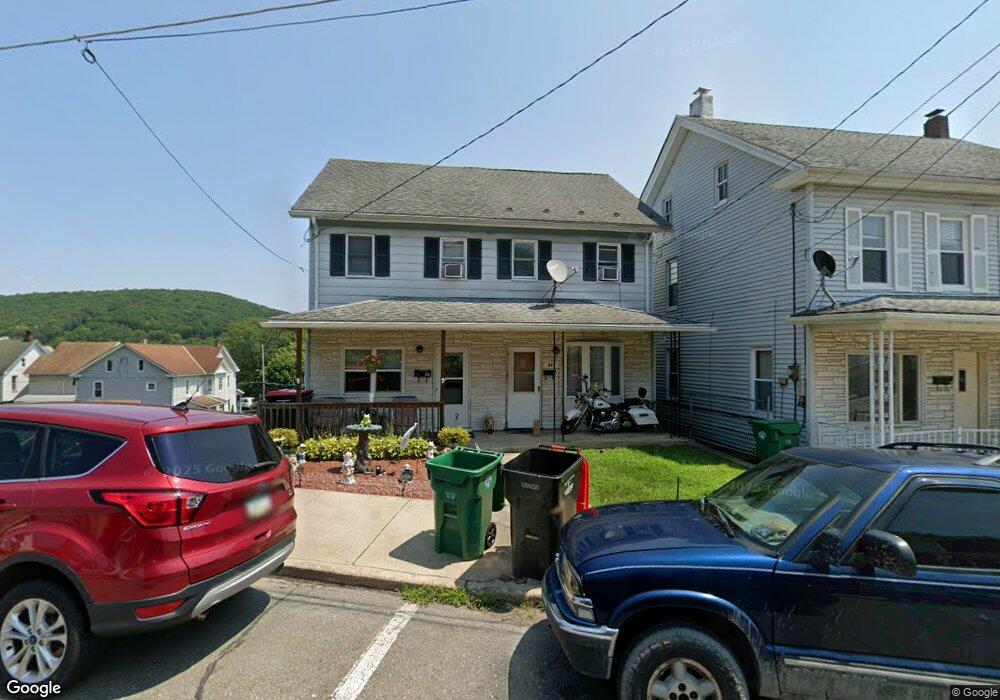
441 N 2nd St Lehighton, PA 18235
Estimated Value: $166,000 - $217,000
3
Beds
2
Baths
1,966
Sq Ft
$94/Sq Ft
Est. Value
About This Home
This home is located at 441 N 2nd St, Lehighton, PA 18235 and is currently estimated at $184,472, approximately $93 per square foot. 441 N 2nd St is a home located in Carbon County with nearby schools including Lehighton Area High School, Sts. Peter & Paul School, and Valley Ridge Academy.
Ownership History
Date
Name
Owned For
Owner Type
Purchase Details
Closed on
Jun 20, 2024
Sold by
Hoffman Tammy L
Bought by
Hager Christopher Thomas and Mansfield Jennie Irene
Current Estimated Value
Home Financials for this Owner
Home Financials are based on the most recent Mortgage that was taken out on this home.
Original Mortgage
$7,500
Interest Rate
7.02%
Purchase Details
Closed on
Jan 27, 2014
Sold by
Weaver Tammy L and Hoffman Tammy L
Bought by
Hoffman Tammy L
Home Financials for this Owner
Home Financials are based on the most recent Mortgage that was taken out on this home.
Original Mortgage
$101,073
Interest Rate
4.75%
Mortgage Type
FHA
Purchase Details
Closed on
Jan 15, 2008
Sold by
Svonavec Michael and Svonavec Kathryn
Bought by
Weaver Tammy L
Create a Home Valuation Report for This Property
The Home Valuation Report is an in-depth analysis detailing your home's value as well as a comparison with similar homes in the area
Home Values in the Area
Average Home Value in this Area
Purchase History
| Date | Buyer | Sale Price | Title Company |
|---|---|---|---|
| Hager Christopher Thomas | $150,000 | None Listed On Document | |
| Hoffman Tammy L | -- | None Available | |
| Weaver Tammy L | $110,000 | None Available |
Source: Public Records
Mortgage History
| Date | Status | Borrower | Loan Amount |
|---|---|---|---|
| Previous Owner | Hager Christopher Thomas | $7,500 | |
| Previous Owner | Hager Christopher Thomas | $145,500 | |
| Previous Owner | Hoffman Tammy L | $101,073 |
Source: Public Records
Tax History Compared to Growth
Tax History
| Year | Tax Paid | Tax Assessment Tax Assessment Total Assessment is a certain percentage of the fair market value that is determined by local assessors to be the total taxable value of land and additions on the property. | Land | Improvement |
|---|---|---|---|---|
| 2025 | $2,401 | $30,100 | $4,700 | $25,400 |
| 2024 | $2,281 | $30,100 | $4,700 | $25,400 |
| 2023 | $2,258 | $30,100 | $4,700 | $25,400 |
| 2022 | $2,258 | $30,100 | $4,700 | $25,400 |
| 2021 | $2,179 | $30,100 | $4,700 | $25,400 |
| 2020 | $2,126 | $30,100 | $4,700 | $25,400 |
| 2019 | $2,036 | $30,100 | $4,700 | $25,400 |
| 2018 | $1,991 | $30,100 | $4,700 | $25,400 |
| 2017 | $1,975 | $30,100 | $4,700 | $25,400 |
| 2016 | -- | $30,100 | $4,700 | $25,400 |
| 2015 | -- | $30,100 | $4,700 | $25,400 |
| 2014 | -- | $30,100 | $4,700 | $25,400 |
Source: Public Records
Map
Nearby Homes
- 230 Carbon St
- 344 Ochre St
- 231 Coal St
- 215 N 4th St
- 117 N 4th St
- 470 N 8th St
- 193 S 4th St
- 193 S 4th St Unit 191-193
- 0 Fairyland Rd Unit PM-136987
- 230 S 2nd St
- 236 S 2nd St
- 522 Iron St
- 142 Bankway St
- 639 Iron St
- 12 2nd Ave
- 0 Pine Hollow Dr Unit PACC2006714
- 0 Pine Hollow Dr Unit PM-135085
- 0 Pine Hollow Dr Unit 763487
- 410 S 8th St
- 438 White St