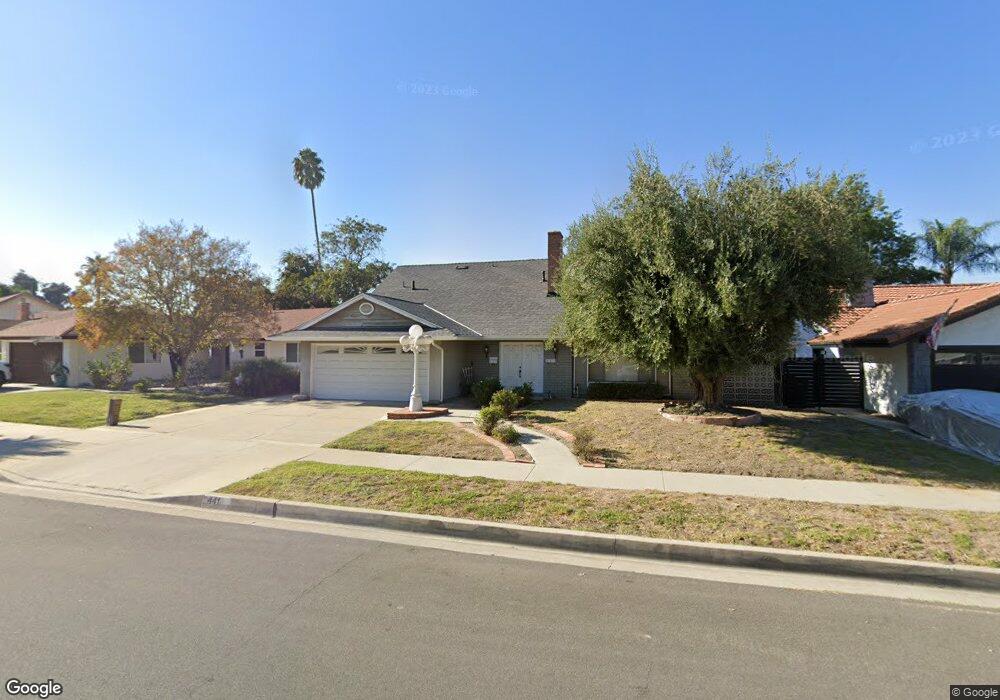
441 Navajo Springs Rd Diamond Bar, CA 91765
Estimated Value: $896,477 - $996,000
4
Beds
2
Baths
1,859
Sq Ft
$508/Sq Ft
Est. Value
About This Home
This home is located at 441 Navajo Springs Rd, Diamond Bar, CA 91765 and is currently estimated at $944,869, approximately $508 per square foot. 441 Navajo Springs Rd is a home located in Los Angeles County with nearby schools including Diamond Point Elementary School, Golden Springs Elementary School, and Lorbeer Middle School.
Ownership History
Date
Name
Owned For
Owner Type
Purchase Details
Closed on
Jul 27, 2011
Sold by
Radnitz Alan and Radnitz Rena
Bought by
Wong Terry Ching and Wong Pauline Han
Current Estimated Value
Home Financials for this Owner
Home Financials are based on the most recent Mortgage that was taken out on this home.
Original Mortgage
$150,000
Outstanding Balance
$103,421
Interest Rate
4.48%
Mortgage Type
New Conventional
Estimated Equity
$841,448
Purchase Details
Closed on
Nov 8, 2010
Sold by
Bell Brian K and Biggs Kathryn
Bought by
Radnitz Alan and Radnitz Rena
Purchase Details
Closed on
Dec 30, 2004
Sold by
Allison Terri L
Bought by
Bell Brian K and Biggs Kathryn
Home Financials for this Owner
Home Financials are based on the most recent Mortgage that was taken out on this home.
Original Mortgage
$375,000
Interest Rate
5.25%
Mortgage Type
Purchase Money Mortgage
Create a Home Valuation Report for This Property
The Home Valuation Report is an in-depth analysis detailing your home's value as well as a comparison with similar homes in the area
Home Values in the Area
Average Home Value in this Area
Purchase History
| Date | Buyer | Sale Price | Title Company |
|---|---|---|---|
| Wong Terry Ching | $380,000 | Investors Title Company | |
| Radnitz Alan | $342,000 | None Available | |
| Bell Brian K | $475,000 | Chicago Title Co |
Source: Public Records
Mortgage History
| Date | Status | Borrower | Loan Amount |
|---|---|---|---|
| Open | Wong Terry Ching | $150,000 | |
| Previous Owner | Bell Brian K | $375,000 |
Source: Public Records
Tax History Compared to Growth
Tax History
| Year | Tax Paid | Tax Assessment Tax Assessment Total Assessment is a certain percentage of the fair market value that is determined by local assessors to be the total taxable value of land and additions on the property. | Land | Improvement |
|---|---|---|---|---|
| 2025 | $6,221 | $477,165 | $348,299 | $128,866 |
| 2024 | $6,221 | $467,810 | $341,470 | $126,340 |
| 2023 | $6,103 | $458,638 | $334,775 | $123,863 |
| 2022 | $6,008 | $449,646 | $328,211 | $121,435 |
| 2021 | $5,872 | $440,830 | $321,776 | $119,054 |
| 2019 | $5,996 | $427,757 | $312,233 | $115,524 |
| 2018 | $5,545 | $419,370 | $306,111 | $113,259 |
| 2016 | $5,203 | $403,087 | $294,225 | $108,862 |
| 2015 | $5,160 | $397,033 | $289,806 | $107,227 |
| 2014 | $5,124 | $389,257 | $284,130 | $105,127 |
Source: Public Records
Map
Nearby Homes
- 23410 Sunset Crossing Rd Unit D
- 23615 Tellgate Dr
- 23675 Bower Cascade Place
- 23817 Decorah Rd
- 22942 Sunset Crossing Rd
- 23966 Decorah Rd
- 23659 Golden Springs Dr Unit 3F
- 23629 Golden Springs Dr Unit H-2
- 23601 Golden Springs Dr
- 536 N Del Sol Ln
- 330 Ballena Dr
- 415 Charmingdale Rd
- 374 S Prospectors Rd Unit 126
- 23837 Strange Creek Dr
- 158 Cottonwood Cove Dr
- 901 Golden Springs Dr Unit E14
- 901 Golden Springs Dr Unit D13
- 428 Golden Springs Dr Unit E
- 454 Ballena Dr
- 1030 Golden Springs Dr Unit B
- 435 Navajo Springs Rd
- 505 Navajo Springs Rd
- 427 Navajo Springs Rd
- 521 Navajo Springs Rd
- 436 Navajo Springs Rd
- 421 Navajo Springs Rd
- 436 Navajo Springs Rd
- 502 Navajo Springs Rd
- 434 Navajo Springs Rd
- 512 Navajo Springs Rd
- 415 Navajo Springs Rd
- 428 Navajo Springs Rd
- 518 Navajo Springs Rd
- 23410 Sunset Crossing Rd Unit A
- 23410 Sunset Crossing Rd Unit B
- 23410 Sunset Crossing Rd
- 23440 Sunset Crossing Rd Unit A
- 23450 Sunset Crossing Rd Unit C
- 23440 Sunset Crossing Rd Unit B
- 23440 Sunset Crossing Rd Unit D