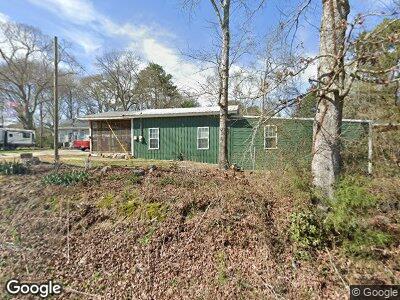
441 Piney Grove Rd Carrollton, GA 30117
Estimated Value: $191,093 - $256,000
2
Beds
1
Bath
900
Sq Ft
$250/Sq Ft
Est. Value
About This Home
This home is located at 441 Piney Grove Rd, Carrollton, GA 30117 and is currently estimated at $225,023, approximately $250 per square foot. 441 Piney Grove Rd is a home located in Carroll County with nearby schools including Central Elementary School, Central Middle School, and Central High School.
Ownership History
Date
Name
Owned For
Owner Type
Purchase Details
Closed on
Jul 3, 2015
Sold by
Head Tracy Lynn
Bought by
Marsh Donna A
Current Estimated Value
Home Financials for this Owner
Home Financials are based on the most recent Mortgage that was taken out on this home.
Original Mortgage
$90,000
Interest Rate
3.92%
Mortgage Type
New Conventional
Purchase Details
Closed on
Jun 17, 2009
Sold by
Head Tiffany
Bought by
Head Tracy Lynn
Home Financials for this Owner
Home Financials are based on the most recent Mortgage that was taken out on this home.
Original Mortgage
$20,000
Interest Rate
4.79%
Mortgage Type
New Conventional
Purchase Details
Closed on
Nov 28, 2005
Sold by
Kunkler Jeff C
Bought by
Head Tiffany
Home Financials for this Owner
Home Financials are based on the most recent Mortgage that was taken out on this home.
Original Mortgage
$89,500
Interest Rate
6.1%
Mortgage Type
FHA
Purchase Details
Closed on
May 20, 2004
Sold by
Frashier Robby
Bought by
Kunkler Jeff C
Purchase Details
Closed on
Jun 4, 2003
Sold by
Griffin Tim D
Bought by
Frashier Robby
Purchase Details
Closed on
Apr 25, 2003
Sold by
Frashier Robby
Bought by
Frashier Robby
Purchase Details
Closed on
Oct 31, 2000
Sold by
Sullivan Kathy A
Bought by
Griffin Tim D
Create a Home Valuation Report for This Property
The Home Valuation Report is an in-depth analysis detailing your home's value as well as a comparison with similar homes in the area
Home Values in the Area
Average Home Value in this Area
Purchase History
| Date | Buyer | Sale Price | Title Company |
|---|---|---|---|
| Marsh Donna A | $95,000 | -- | |
| Head Tracy Lynn | $87,000 | -- | |
| Head Tiffany | $90,930 | -- | |
| Kunkler Jeff C | $62,500 | -- | |
| Frashier Robby | $56,000 | -- | |
| Frashier Robby | -- | -- | |
| Griffin Tim D | $40,000 | -- |
Source: Public Records
Mortgage History
| Date | Status | Borrower | Loan Amount |
|---|---|---|---|
| Open | Marsh Donna A | $120,000 | |
| Closed | Marsh Donna A | $90,000 | |
| Previous Owner | Head Tracy Lynn | $20,000 | |
| Previous Owner | Head Tiffany | $89,500 |
Source: Public Records
Tax History Compared to Growth
Tax History
| Year | Tax Paid | Tax Assessment Tax Assessment Total Assessment is a certain percentage of the fair market value that is determined by local assessors to be the total taxable value of land and additions on the property. | Land | Improvement |
|---|---|---|---|---|
| 2024 | $1,477 | $65,278 | $5,853 | $59,425 |
| 2023 | $1,477 | $61,097 | $4,683 | $56,414 |
| 2022 | $1,216 | $48,474 | $3,122 | $45,352 |
| 2021 | $1,138 | $44,395 | $2,498 | $41,897 |
| 2020 | $971 | $37,810 | $2,270 | $35,540 |
| 2019 | $936 | $36,172 | $2,270 | $33,902 |
| 2018 | $646 | $24,617 | $1,845 | $22,772 |
| 2017 | $648 | $24,617 | $1,845 | $22,772 |
| 2016 | $649 | $24,617 | $1,845 | $22,772 |
| 2015 | $770 | $31,539 | $8,000 | $23,539 |
| 2014 | $774 | $31,539 | $8,000 | $23,539 |
Source: Public Records
Map
Nearby Homes
- 28 Boulder Dr
- 0 Bonner Rd Unit 10471564
- 134 Piney Grove Rd
- 0 Buffalo Creek Rd Unit 144774
- 0 Buffalo Creek Rd Unit 10201789
- 533 Buffalo Creek Rd
- 135 Camp Ln
- 105 Fuller Dr
- 794 Simonton Mill Rd
- 20 Shadow Ln
- 111 Dunwoody Dr
- 397 Maple View Dr
- 107 Live Oak Ln
- 130 Maple Crossing Unit LOT 2
- 130 Maple Crossing Unit 1
- 400 Maple View Dr
- 315 Maple View Dr
- 441 Piney Grove Rd
- 115 Woodbine Dr
- 445 Piney Grove Rd
- 125 Woodbine Dr
- 105 Woodbine Dr
- 440 Piney Grove Rd
- 730 Old Camp Church Rd
- 95 Woodbine Dr
- 726 Old Camp Church Rd
- 720 Old Camp Church Rd Unit 20
- 720 Old Camp Church Rd
- 130 Woodbine Dr
- 420 Piney Grove Rd
- 90 Woodbine Dr
- 760 Old Camp Church Rd
- 707 Old Camp Church Rd
- 80 Woodbine Dr
- 75 Woodbine Dr
- 75 Woodbine Dr
- 75 Woodbine Dr