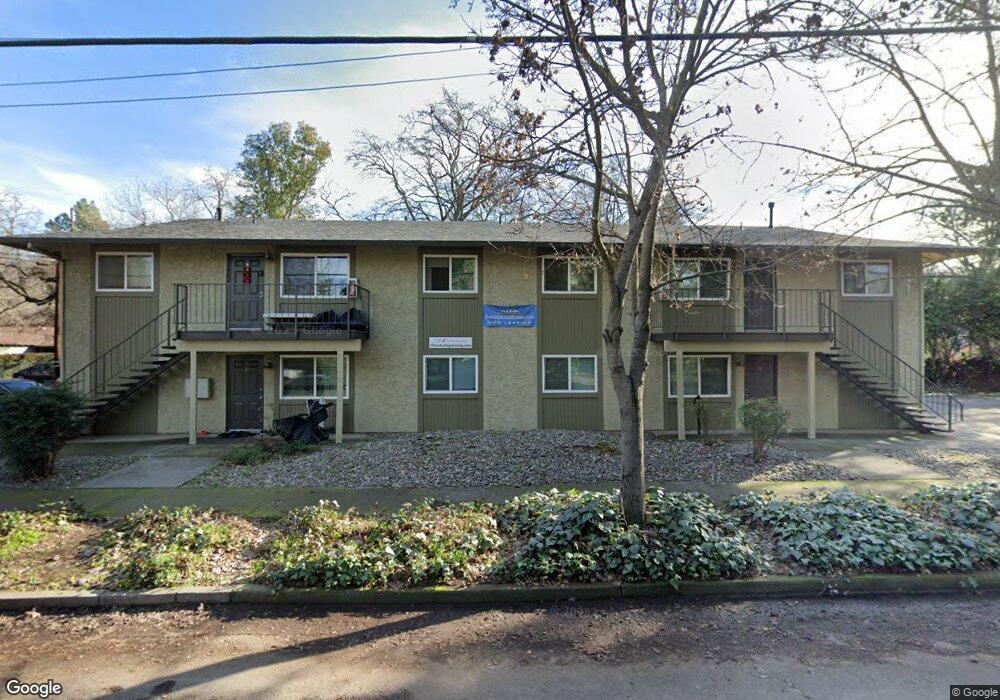
441 W 2nd Ave Unit 1-4 Chico, CA 95926
Chico Vecino NeighborhoodEstimated Value: $1,029,000 - $1,092,000
4
Beds
2
Baths
1,287
Sq Ft
$819/Sq Ft
Est. Value
About This Home
This home is located at 441 W 2nd Ave Unit 1-4, Chico, CA 95926 and is currently estimated at $1,053,452, approximately $818 per square foot. 441 W 2nd Ave Unit 1-4 is a home located in Butte County with nearby schools including Citrus Avenue Elementary School, Chico Junior High School, and Chico High School.
Ownership History
Date
Name
Owned For
Owner Type
Purchase Details
Closed on
Dec 16, 2022
Sold by
Sundberg Trust
Bought by
Kessener Family Trust
Current Estimated Value
Purchase Details
Closed on
Jul 5, 2019
Sold by
Buckingham James Richard and Buckingham Linda Louise Beatty
Bought by
Buckingham James Richard and Buckingham Linda Louise Beatty
Purchase Details
Closed on
Jul 3, 2019
Sold by
Buckingham William D
Bought by
Buckingham James Richard and Buckingham Linda Beatty
Purchase Details
Closed on
Feb 8, 2013
Sold by
Laffins Ronald J and Laffins Claudine J
Bought by
Sundberg Dixie Ford
Purchase Details
Closed on
Feb 17, 2000
Sold by
Laffins Ronald J
Bought by
Laffins Ronald J and Laffins Claudine J
Purchase Details
Closed on
Feb 3, 1997
Sold by
Brownfield Marilyn A
Bought by
Laffins Ronald J
Create a Home Valuation Report for This Property
The Home Valuation Report is an in-depth analysis detailing your home's value as well as a comparison with similar homes in the area
Home Values in the Area
Average Home Value in this Area
Purchase History
| Date | Buyer | Sale Price | Title Company |
|---|---|---|---|
| Kessener Family Trust | $975,000 | Mid Valley Title | |
| Buckingham James Richard | -- | None Available | |
| Buckingham James Richard | $21,000 | None Available | |
| Sundberg Dixie Ford | $440,000 | Fidelity Natl Title Co Of Ca | |
| Laffins Ronald J | -- | -- | |
| Laffins Ronald J | -- | Bidwell Title & Escrow Compa |
Source: Public Records
Tax History
| Year | Tax Paid | Tax Assessment Tax Assessment Total Assessment is a certain percentage of the fair market value that is determined by local assessors to be the total taxable value of land and additions on the property. | Land | Improvement |
|---|---|---|---|---|
| 2025 | $11,029 | $1,017,590 | $171,666 | $845,924 |
| 2024 | $11,029 | $994,500 | $168,300 | $826,200 |
| 2023 | $10,900 | $978,200 | $165,000 | $813,200 |
| 2022 | $6,024 | $537,739 | $135,238 | $402,501 |
| 2021 | $5,911 | $527,259 | $132,587 | $394,672 |
| 2020 | $5,895 | $521,886 | $131,228 | $390,658 |
| 2019 | $5,532 | $488,913 | $126,947 | $361,966 |
| 2018 | $5,431 | $479,390 | $124,458 | $354,932 |
| 2017 | $5,322 | $470,054 | $122,018 | $348,036 |
| 2016 | $4,858 | $460,901 | $119,626 | $341,275 |
| 2015 | $4,858 | $454,027 | $117,830 | $336,197 |
| 2014 | $4,742 | $445,197 | $115,522 | $329,675 |
Source: Public Records
Map
Nearby Homes
- 438 W 1st Ave
- 1421 Citrus Ave
- 642 W 1st Ave
- 703 W 2nd Ave
- 609 Rancheria Dr
- 1412 N Cherry St Unit 9
- 12 Klondike Ct
- 1362 Magnolia Ave
- 811 W 2nd Ave
- 810 W 1st Ave
- 1617 Arcadian Ave
- 1050 Esplanade
- 168 E 1st Ave
- 256 E 1st Ave
- 1114 Nord Ave Unit 8
- 363 E 1st Ave
- 1122 Stewart Ave
- 1397 Nord Ave
- 1395 Nord Ave
- 496 E 3rd Ave
- 441 W 2nd Ave
- 1170 Hobart St
- 0 Hobart St
- 438 W 2nd Ave
- 448 W 2nd Ave
- 1166 Hobart St
- 1166 Hobart St Unit 1-4
- 1166 Hobart St
- 430 W 2nd Ave
- 1199 Citrus Ave
- 1195 Hobart St
- 1187 Hobart St Unit A
- 1222 Hobart St
- 1173 Citrus Ave
- 1158 Hobart St
- 424 W 2nd Ave
- 1205 Citrus Ave
- 1211 Citrus Ave
- 1175 Hobart St
- 1215 Hobart St
Your Personal Tour Guide
Ask me questions while you tour the home.