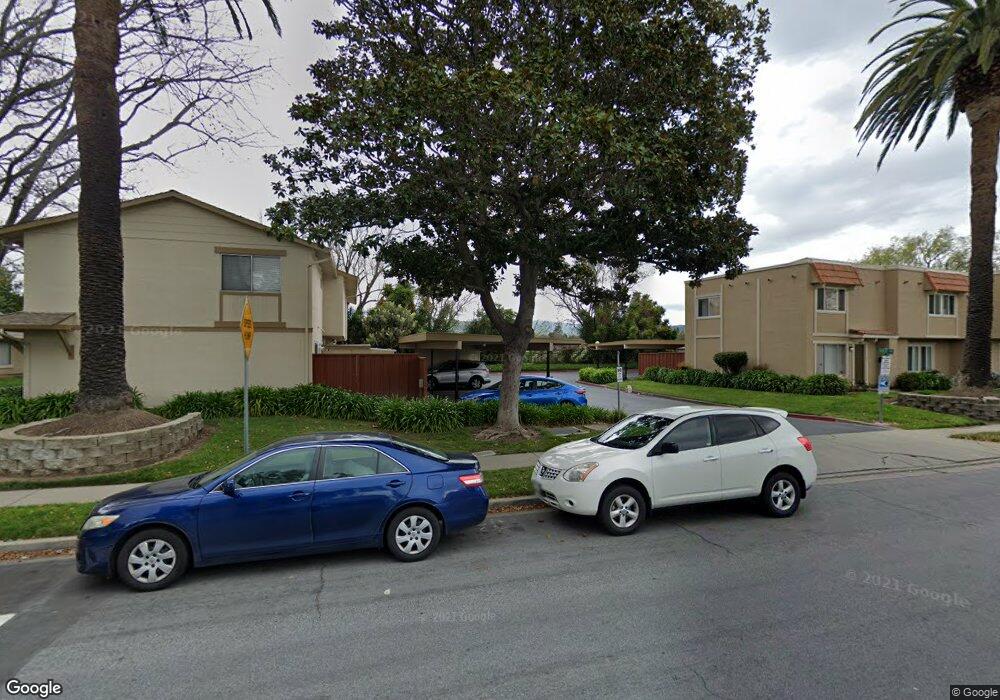
4410 Elaiso Common Fremont, CA 94536
Estimated Value: $861,000 - $930,000
4
Beds
3
Baths
1,474
Sq Ft
$606/Sq Ft
Est. Value
About This Home
This home is located at 4410 Elaiso Common, Fremont, CA 94536 and is currently estimated at $892,640, approximately $605 per square foot. 4410 Elaiso Common is a home located in Alameda County with nearby schools including Oliveira Elementary School, Thornton Middle School, and American High School.
Ownership History
Date
Name
Owned For
Owner Type
Purchase Details
Closed on
Aug 17, 2024
Sold by
Shi Maggie Ying
Bought by
Maggie Ying Shi Living Trust and Shi
Current Estimated Value
Purchase Details
Closed on
May 25, 2007
Sold by
Shi Maggie Y and Shi Maggie Ying
Bought by
Shi Maggie Y
Home Financials for this Owner
Home Financials are based on the most recent Mortgage that was taken out on this home.
Original Mortgage
$390,400
Interest Rate
6.12%
Mortgage Type
New Conventional
Purchase Details
Closed on
Feb 9, 2007
Sold by
Jeong Seong Chi and Jeong Seok Ja
Bought by
Shi Ying Maggie
Home Financials for this Owner
Home Financials are based on the most recent Mortgage that was taken out on this home.
Original Mortgage
$414,800
Interest Rate
1.75%
Mortgage Type
Purchase Money Mortgage
Create a Home Valuation Report for This Property
The Home Valuation Report is an in-depth analysis detailing your home's value as well as a comparison with similar homes in the area
Home Values in the Area
Average Home Value in this Area
Purchase History
| Date | Buyer | Sale Price | Title Company |
|---|---|---|---|
| Maggie Ying Shi Living Trust | -- | None Listed On Document | |
| Shi Maggie Y | -- | Commonwealth Land Title | |
| Shi Ying Maggie | $488,000 | Financial Title Company |
Source: Public Records
Mortgage History
| Date | Status | Borrower | Loan Amount |
|---|---|---|---|
| Previous Owner | Shi Maggie Y | $390,400 | |
| Previous Owner | Shi Ying Maggie | $414,800 |
Source: Public Records
Tax History Compared to Growth
Tax History
| Year | Tax Paid | Tax Assessment Tax Assessment Total Assessment is a certain percentage of the fair market value that is determined by local assessors to be the total taxable value of land and additions on the property. | Land | Improvement |
|---|---|---|---|---|
| 2025 | $7,930 | $646,763 | $196,129 | $457,634 |
| 2024 | $7,930 | $633,948 | $192,284 | $448,664 |
| 2023 | $7,714 | $628,382 | $188,514 | $439,868 |
| 2022 | $7,610 | $609,065 | $184,819 | $431,246 |
| 2021 | $7,430 | $596,987 | $181,196 | $422,791 |
| 2020 | $7,426 | $597,794 | $179,338 | $418,456 |
| 2019 | $7,341 | $586,077 | $175,823 | $410,254 |
| 2018 | $7,197 | $574,590 | $172,377 | $402,213 |
| 2017 | $7,017 | $563,327 | $168,998 | $394,329 |
| 2016 | $6,894 | $552,283 | $165,685 | $386,598 |
| 2015 | $6,797 | $543,992 | $163,197 | $380,795 |
| 2014 | $5,420 | $426,000 | $127,800 | $298,200 |
Source: Public Records
Map
Nearby Homes
- 4412 Elaiso Common
- 4543 Bartolo Terrace
- 4632 Balboa Way
- 37001 Contra Costa Ave
- 4544 Thornton Ave
- 36521 Cabrillo Dr
- 4637 Rothbury Common
- 36304 Magellan Dr
- 36347 Magellan Dr
- 35942 Adobe Dr
- 37114 Dondero Way
- 35978 Magellan Dr
- 36139 San Pedro Dr
- 3751 Ruskin Place
- 35936 Magellan Dr
- 4626 Alhambra Dr
- 35856 Adobe Dr
- 36202 Worthing Dr
- 4955 Swindon Place
- 36288 Saxon Ct
- 4408 Elaiso Common
- 36800 Coronado Dr
- 4414 Elaiso Common
- 4402 Soca Terrace
- 4404 Soca Terrace
- 4409 Elaiso Common
- 4400 Soca Terrace
- 4406 Soca Terrace
- 4411 Elaiso Common
- 4413 Elaiso Common
- 4502 Guiso Common
- 4415 Elaiso Common
- 4527 Virio Common
- 4504 Guiso Common
- 4525 Virio Common
- 4417 Elaiso Common
- 4523 Virio Common
- 4506 Guiso Common
- 4419 Elaiso Common
- 4521 Virio Common