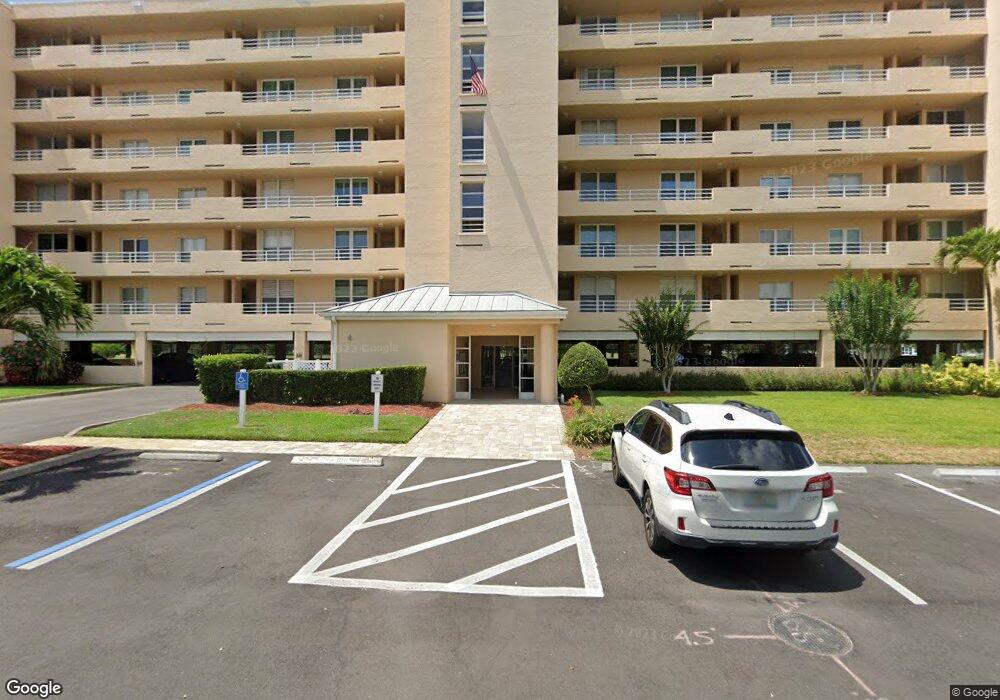
4410 Fairways Blvd Unit 408 Bradenton, FL 34209
West Bradenton NeighborhoodEstimated Value: $240,000 - $336,000
2
Beds
2
Baths
1,396
Sq Ft
$199/Sq Ft
Est. Value
About This Home
This home is located at 4410 Fairways Blvd Unit 408, Bradenton, FL 34209 and is currently estimated at $277,925, approximately $199 per square foot. 4410 Fairways Blvd Unit 408 is a home located in Manatee County with nearby schools including H. S. Moody Elementary School, W. D. Sugg Middle School, and Bayshore High School.
Ownership History
Date
Name
Owned For
Owner Type
Purchase Details
Closed on
Jul 22, 2025
Sold by
Kelley Ethel A and Kelley James J
Bought by
Kelley Ethel A and Ethel A Kelley Revocable Trust
Current Estimated Value
Purchase Details
Closed on
Jan 17, 2020
Sold by
Kelley James J and Kelley Ethel A
Bought by
Kelley James J and Kelley Ethel A
Purchase Details
Closed on
Jan 14, 2004
Sold by
Kelley James J and Kelley Ethel A
Bought by
Kelley Donna Marie and Kelley John James
Purchase Details
Closed on
Jul 25, 2002
Sold by
Strom Virginia
Bought by
Kelley James J and Kelley Ethel A
Purchase Details
Closed on
Apr 11, 2002
Sold by
Pesola Bergliot H
Bought by
Kelley James J and Kelley Ethel A
Home Financials for this Owner
Home Financials are based on the most recent Mortgage that was taken out on this home.
Original Mortgage
$40,000
Interest Rate
6.8%
Create a Home Valuation Report for This Property
The Home Valuation Report is an in-depth analysis detailing your home's value as well as a comparison with similar homes in the area
Home Values in the Area
Average Home Value in this Area
Purchase History
| Date | Buyer | Sale Price | Title Company |
|---|---|---|---|
| Kelley Ethel A | $100 | None Listed On Document | |
| Kelley James J | -- | Attorney | |
| Kelley Donna Marie | -- | -- | |
| Kelley James J | -- | -- | |
| Kelley James J | $140,000 | -- |
Source: Public Records
Mortgage History
| Date | Status | Borrower | Loan Amount |
|---|---|---|---|
| Previous Owner | Kelley James J | $40,000 |
Source: Public Records
Tax History Compared to Growth
Tax History
| Year | Tax Paid | Tax Assessment Tax Assessment Total Assessment is a certain percentage of the fair market value that is determined by local assessors to be the total taxable value of land and additions on the property. | Land | Improvement |
|---|---|---|---|---|
| 2025 | $1,284 | $119,355 | -- | -- |
| 2024 | $1,284 | $115,991 | -- | -- |
| 2023 | $1,248 | $112,613 | $0 | $0 |
| 2022 | $1,284 | $109,333 | $0 | $0 |
| 2021 | $1,215 | $106,149 | $0 | $0 |
| 2020 | $1,156 | $104,683 | $0 | $0 |
| 2019 | $1,122 | $102,329 | $0 | $0 |
| 2018 | $1,099 | $100,421 | $0 | $0 |
| 2017 | $1,007 | $98,356 | $0 | $0 |
| 2016 | $990 | $96,333 | $0 | $0 |
| 2015 | $992 | $95,663 | $0 | $0 |
| 2014 | $992 | $94,904 | $0 | $0 |
| 2013 | $977 | $93,501 | $1 | $93,500 |
Source: Public Records
Map
Nearby Homes
- 4410 Fairways Blvd Unit 607
- 4460 Fairways Blvd Unit 205
- 4460 Fairways Blvd Unit 607
- 4460 Fairways Blvd Unit 401
- 4460 Fairways Blvd Unit 304
- 4460 Fairways Blvd Unit 605
- 4460 Fairways Blvd Unit 402
- 4460 Fairways Blvd #604 Blvd Unit 604
- 4440 Fairways Blvd Unit 407
- 4440 Fairways Blvd Unit 310
- 3780 Pinebrook Cir Unit 504
- 4570 Pinebrook Cir Unit 508
- 3750 Pinebrook Cir Unit 104
- 3840 Ironwood Ln Unit 506H
- 3840 Ironwood Ln Unit 501H
- 3860 Ironwood Ln Unit 503G
- 4550 Pinebrook Cir Unit 608
- 4550 Pinebrook Cir Unit 505
- 4550 Pinebrook Cir Unit 304
- 4240 Ironwood Cir Unit 302A-A
- 4410 Fairways Blvd Unit 507
- 4410 Fairways Blvd Unit 203
- 4410 Fairways Blvd Unit 101
- 4410 Fairways Blvd Unit 102
- 4410 Fairways Blvd Unit 303
- 4410 Fairways Blvd Unit 301
- 4410 Fairways Blvd Unit 206
- 4410 Fairways Blvd Unit 306
- 4410 Fairways Blvd Unit 308
- 4410 Fairways Blvd Unit 201
- 4410 Fairways Blvd Unit 503
- 4410 Fairways Blvd Unit 401
- 4410 Fairways Blvd Unit 403
- 4410 Fairways Blvd Unit 302
- 4410 Fairways Blvd Unit 501
- 4410 Fairways Blvd Unit 204
- 4410 Fairways Blvd Unit 604
- 4410 Fairways Blvd Unit 608
- 4410 Fairways Blvd Unit 606