Estimated Value: $313,000 - $340,000
4
Beds
2
Baths
2,310
Sq Ft
$143/Sq Ft
Est. Value
About This Home
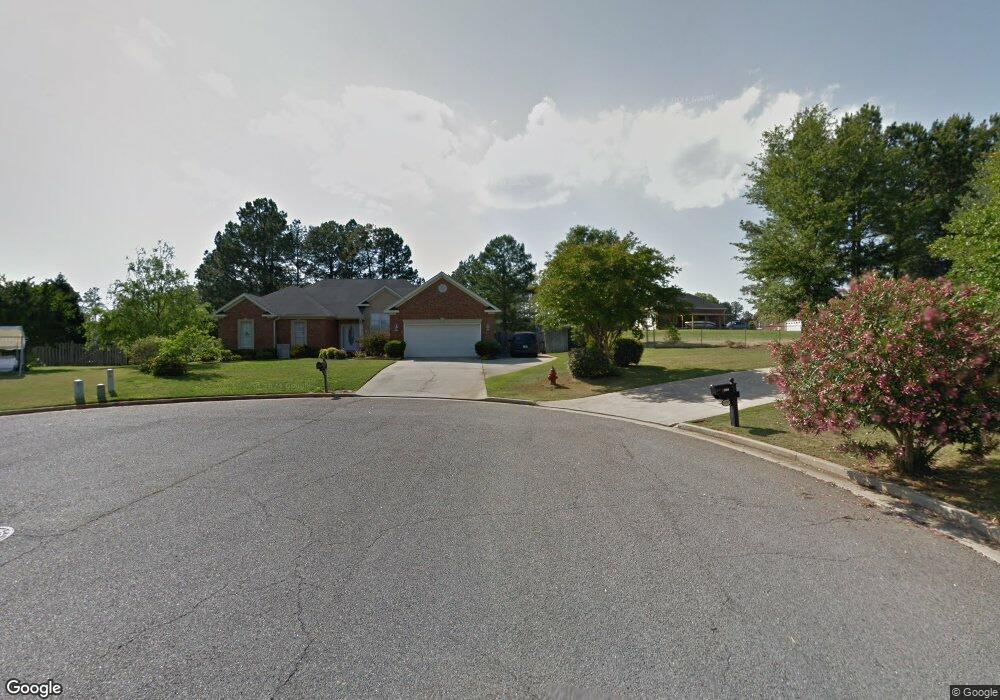
This home is located at 4410 Kameron Ct, Evans, GA 30809 and is currently estimated at $330,712, approximately $143 per square foot. 4410 Kameron Ct is a home located in Columbia County with nearby schools including River Ridge Elementary School, Riverside Middle School, and Lakeside High School.
Ownership History
Date
Name
Owned For
Owner Type
Purchase Details
Closed on
Jan 14, 2003
Sold by
Helberg Frederick
Bought by
Smith Cynthia A
Current Estimated Value
Home Financials for this Owner
Home Financials are based on the most recent Mortgage that was taken out on this home.
Original Mortgage
$122,000
Interest Rate
5.99%
Mortgage Type
Purchase Money Mortgage
Purchase Details
Closed on
Dec 20, 2002
Sold by
Smith Cynthia A
Bought by
Helberg Frederick
Home Financials for this Owner
Home Financials are based on the most recent Mortgage that was taken out on this home.
Original Mortgage
$122,000
Interest Rate
5.99%
Mortgage Type
Purchase Money Mortgage
Purchase Details
Closed on
Jul 17, 2001
Sold by
Hilley Michael D and Hilley Teri H
Bought by
Smith Cynthia A
Home Financials for this Owner
Home Financials are based on the most recent Mortgage that was taken out on this home.
Original Mortgage
$120,000
Interest Rate
7.16%
Create a Home Valuation Report for This Property
The Home Valuation Report is an in-depth analysis detailing your home's value as well as a comparison with similar homes in the area
Home Values in the Area
Average Home Value in this Area
Purchase History
We collect this data history from publicly available records. To have your information removed, we recommend requesting removal directly through your county’s website.
| Date | Buyer | Sale Price | Title Company |
|---|---|---|---|
| Smith Cynthia A | -- | -- | |
| Helberg Frederick | -- | -- | |
| Smith Cynthia A | $150,000 | -- |
Source: Public Records
Mortgage History
We collect this data history from publicly available records. To have your information removed, we recommend requesting removal directly through your county’s website.
| Date | Status | Borrower | Loan Amount |
|---|---|---|---|
| Closed | Helberg Frederick | $122,000 | |
| Previous Owner | Smith Cynthia A | $120,000 |
Source: Public Records
Tax History
| Year | Tax Paid | Tax Assessment Tax Assessment Total Assessment is a certain percentage of the fair market value that is determined by local assessors to be the total taxable value of land and additions on the property. | Land | Improvement |
|---|---|---|---|---|
| 2025 | $1,010 | $126,896 | $25,804 | $101,092 |
| 2024 | $1,122 | $136,798 | $25,804 | $110,994 |
| 2023 | $1,122 | $112,151 | $20,604 | $91,547 |
| 2022 | $946 | $104,664 | $19,304 | $85,360 |
| 2021 | $928 | $97,491 | $18,704 | $78,787 |
| 2020 | $938 | $94,814 | $18,204 | $76,610 |
| 2019 | $869 | $87,449 | $16,404 | $71,045 |
| 2018 | $855 | $85,060 | $15,404 | $69,656 |
| 2017 | $2,381 | $84,999 | $15,904 | $69,095 |
| 2016 | $1,665 | $80,124 | $15,180 | $64,944 |
| 2015 | $1,991 | $73,536 | $14,180 | $59,356 |
| 2014 | $2,041 | $74,494 | $14,180 | $60,314 |
Source: Public Records
Map
Nearby Homes
- 125 Central Park Ln
- 118 Central Park Ln
- 780 Springbrook Cir
- 4415 Pierwood Way
- 4418 Pierwood Way
- 4478 Cape Cod Dr
- 829 Woodberry Dr
- 612 Emerald Crossing
- 4481 Woodberry Ct
- 4480 Cape Cod Dr
- 608 Emerald Crossing
- 853 Sparkleberry Rd
- 4489 Woodberry Ct
- 4441 Pierwood Way
- 909 Burlington Dr
- 645 Emerald Crossing
- 802 Sparkleberry Rd
- 4428 Deer Run
- 656 Deerwood Way
- 718 Deerwood Place
- 4410 Kameroon Ct
- 4408 Kameron Ct
- 4393 Marshall Ct
- 4409 Kameron Ct
- 4395 Marshall Ct
- 4409 Kameroon Ct
- 4389 Marshall Way
- 4406 Kameron Ct
- 4407 Kameroon Ct
- 4407 Kameron Ct
- 4405 Kameroon Ct
- 4404 Kameroon Ct
- 4387 Marshall Way
- 4405 Kameron Ct
- 4404 Kameron Ct
- 4385 Marshall Way
- 4391 Marshall Ct
- 715 Adcock Ct
- 4397 Marshall Ct
- 4403 Kameroon Ct
Your Personal Tour Guide
Ask me questions while you tour the home.