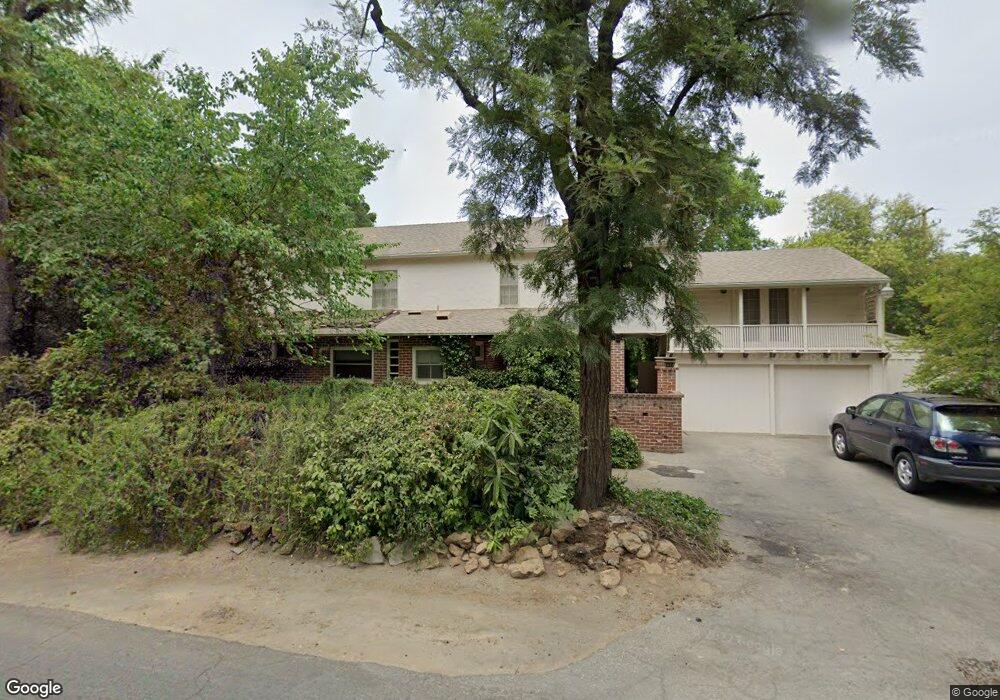
4410 N Van Ness Blvd Fresno, CA 93704
Fig Garden NeighborhoodEstimated Value: $727,000 - $1,187,000
6
Beds
5
Baths
4,409
Sq Ft
$205/Sq Ft
Est. Value
About This Home
This home is located at 4410 N Van Ness Blvd, Fresno, CA 93704 and is currently estimated at $905,692, approximately $205 per square foot. 4410 N Van Ness Blvd is a home located in Fresno County with nearby schools including Powers-Ginsburg Elementary, Bullard High School, and Endeavor Charter.
Ownership History
Date
Name
Owned For
Owner Type
Purchase Details
Closed on
Dec 29, 2017
Sold by
Bruny Carol Ann and Pritchett Gianna Maria
Bought by
Bruny Carol Ann and Prichett Gianna Maria
Current Estimated Value
Purchase Details
Closed on
Sep 20, 2001
Sold by
Bruny Stephen J and Bruny Carol Ann
Bought by
Bruny Stephen J and Bruny Carol Ann
Home Financials for this Owner
Home Financials are based on the most recent Mortgage that was taken out on this home.
Original Mortgage
$125,000
Interest Rate
7%
Purchase Details
Closed on
Sep 7, 2001
Sold by
Bruny Stephen J and Bruny Carol Ann
Bought by
Bruny Stephen J and Bruny Carol Ann
Home Financials for this Owner
Home Financials are based on the most recent Mortgage that was taken out on this home.
Original Mortgage
$125,000
Interest Rate
7%
Purchase Details
Closed on
Mar 19, 1997
Sold by
Bruny Stephen J and Bruny Carol A
Bought by
Bruny Stephen J and Bruny Carol Ann
Create a Home Valuation Report for This Property
The Home Valuation Report is an in-depth analysis detailing your home's value as well as a comparison with similar homes in the area
Home Values in the Area
Average Home Value in this Area
Purchase History
| Date | Buyer | Sale Price | Title Company |
|---|---|---|---|
| Bruny Carol Ann | -- | None Available | |
| Bruny Stephen J | -- | -- | |
| Bruny Stephen J | -- | Fidelity National Title Co | |
| Bruny Stephen J | -- | -- |
Source: Public Records
Mortgage History
| Date | Status | Borrower | Loan Amount |
|---|---|---|---|
| Closed | Bruny Stephen J | $125,000 |
Source: Public Records
Tax History Compared to Growth
Tax History
| Year | Tax Paid | Tax Assessment Tax Assessment Total Assessment is a certain percentage of the fair market value that is determined by local assessors to be the total taxable value of land and additions on the property. | Land | Improvement |
|---|---|---|---|---|
| 2025 | $4,174 | $227,973 | $28,846 | $199,127 |
| 2023 | $4,066 | $219,123 | $27,727 | $191,396 |
| 2022 | $3,987 | $214,828 | $27,184 | $187,644 |
| 2021 | $3,822 | $210,616 | $26,651 | $183,965 |
| 2020 | $3,742 | $208,457 | $26,378 | $182,079 |
| 2019 | $3,693 | $204,370 | $25,861 | $178,509 |
| 2018 | $3,578 | $200,363 | $25,354 | $175,009 |
| 2017 | $3,493 | $196,435 | $24,857 | $171,578 |
| 2016 | $3,376 | $192,584 | $24,370 | $168,214 |
| 2015 | $3,313 | $189,692 | $24,004 | $165,688 |
| 2014 | $3,258 | $185,977 | $23,534 | $162,443 |
Source: Public Records
Map
Nearby Homes
- 825 E Indianapolis Ave
- 4480 N Palm Ave
- 4355 N College Ave
- 336 E Gettysburg Ave
- 4689 N Van Ness Blvd
- 4175 N Van Ness Blvd
- 4481 N Palm Ave
- 1216 E Pico Ave
- 4834 N Wishon Ave
- 4666 N Harrison Ave
- 1408 E Richert Ave
- 705 E Alamos Ave
- 4734 N Harrison Ave
- 4617 N Glenn Ave
- 1444 E Swift Ave
- 1448 E Gettysburg Ave
- 4822 N Safford Ave
- 4633 N Glenn Ave
- 4843 N Palm Ave
- 4678 N Thorne Ave
- 4426 N Van Ness Blvd
- 4390 N Van Ness Blvd
- 4436 N Van Ness Blvd
- 639 E Holland Ave
- 4425 N Wishon Ave
- 4376 N Van Ness Blvd
- 646 E Holland Ave
- 4450 N Van Ness Blvd
- 4373 N Wishon Ave
- 4364 N Van Ness Blvd
- 4449 N Wishon Ave
- 4464 N Van Ness Blvd
- 4361 N Wishon Ave
- 4389 N Van Ness Blvd
- 4352 N Van Ness Blvd
- 4465 N Wishon Ave
- 4476 N Van Ness Blvd
- 4349 N Wishon Ave
- 4369 N Van Ness Blvd
- 4402 N Wishon Ave