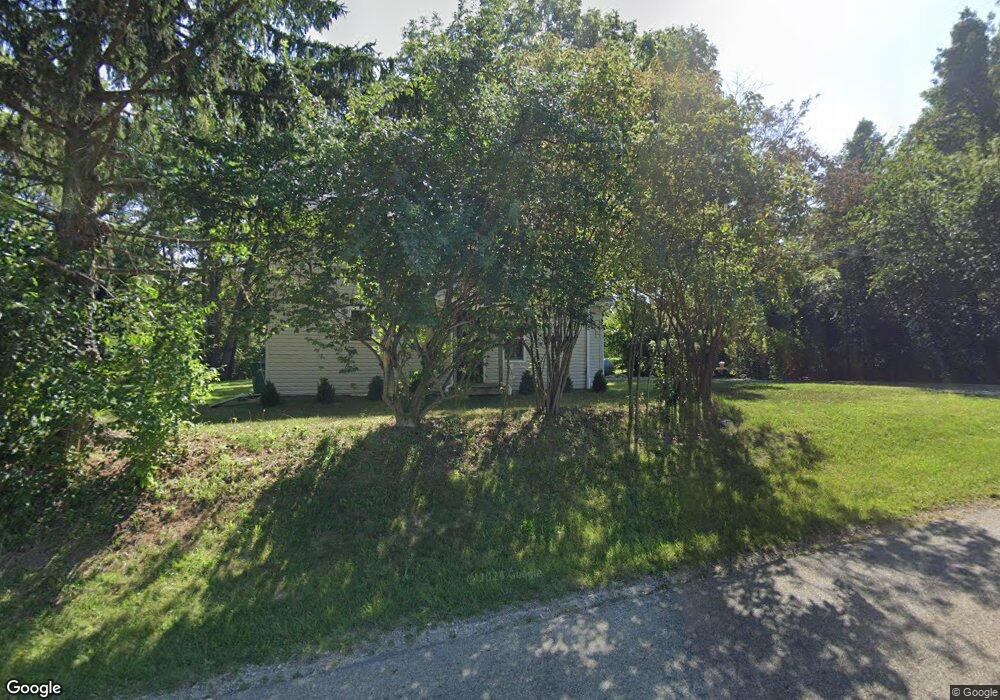
4410 Pickerington Rd Carroll, OH 43112
Bloom NeighborhoodEstimated Value: $222,193 - $259,000
2
Beds
1
Bath
1,124
Sq Ft
$213/Sq Ft
Est. Value
About This Home
This home is located at 4410 Pickerington Rd, Carroll, OH 43112 and is currently estimated at $239,548, approximately $213 per square foot. 4410 Pickerington Rd is a home located in Fairfield County with nearby schools including Bloom Carroll Primary School, Bloom Carroll Intermediate School, and Bloom-Carroll Middle School.
Ownership History
Date
Name
Owned For
Owner Type
Purchase Details
Closed on
Aug 8, 2023
Sold by
Price-Seaton Llc
Bought by
Jones Elisabeth A
Current Estimated Value
Home Financials for this Owner
Home Financials are based on the most recent Mortgage that was taken out on this home.
Original Mortgage
$193,903
Outstanding Balance
$189,402
Interest Rate
6.71%
Mortgage Type
New Conventional
Estimated Equity
$50,146
Purchase Details
Closed on
Sep 2, 2022
Sold by
Properties By Jjsj Ltd
Bought by
Price-Seaton Llc
Home Financials for this Owner
Home Financials are based on the most recent Mortgage that was taken out on this home.
Original Mortgage
$2,186,923
Interest Rate
5.3%
Mortgage Type
Credit Line Revolving
Purchase Details
Closed on
Apr 19, 2017
Sold by
Watterman Janet K and Watterman Richard J
Bought by
Jjsj Ltd
Purchase Details
Closed on
Dec 1, 1987
Bought by
Watterman Janet K
Create a Home Valuation Report for This Property
The Home Valuation Report is an in-depth analysis detailing your home's value as well as a comparison with similar homes in the area
Home Values in the Area
Average Home Value in this Area
Purchase History
| Date | Buyer | Sale Price | Title Company |
|---|---|---|---|
| Jones Elisabeth A | $199,900 | Northwest Title | |
| Price-Seaton Llc | -- | -- | |
| Jjsj Ltd | $40,000 | Valmer Land Title Agency Box | |
| Watterman Janet K | $29,900 | -- |
Source: Public Records
Mortgage History
| Date | Status | Borrower | Loan Amount |
|---|---|---|---|
| Open | Jones Elisabeth A | $193,903 | |
| Previous Owner | Price-Seaton Llc | $2,186,923 |
Source: Public Records
Tax History Compared to Growth
Tax History
| Year | Tax Paid | Tax Assessment Tax Assessment Total Assessment is a certain percentage of the fair market value that is determined by local assessors to be the total taxable value of land and additions on the property. | Land | Improvement |
|---|---|---|---|---|
| 2024 | $4,092 | $49,660 | $20,910 | $28,750 |
| 2023 | $2,152 | $49,660 | $20,910 | $28,750 |
| 2022 | $2,168 | $49,660 | $20,910 | $28,750 |
| 2021 | $1,767 | $36,590 | $16,730 | $19,860 |
| 2020 | $1,786 | $36,590 | $16,730 | $19,860 |
| 2019 | $1,791 | $36,590 | $16,730 | $19,860 |
| 2018 | $1,196 | $25,650 | $14,290 | $11,360 |
| 2017 | $1,113 | $24,970 | $13,610 | $11,360 |
| 2016 | $1,096 | $24,970 | $13,610 | $11,360 |
| 2015 | $1,080 | $23,920 | $13,610 | $10,310 |
| 2014 | $1,036 | $23,920 | $13,610 | $10,310 |
| 2013 | $1,036 | $23,920 | $13,610 | $10,310 |
Source: Public Records
Map
Nearby Homes
- 4180 Stone Hill Drive East NW
- 4900 Pickerington Rd NW
- 6920 Winchester Rd NW
- 8322 Benson Rd
- 62 Oberle Ave
- 52 W Canal St
- 2155 Carroll-Southern Rd NW
- 7985 Lithopolis Rd NW
- 5311 Mason Rd NW
- 5341 Carnes Rd
- 7234 Pickerington Rd
- 1975 Lamb Rd NW
- 7190 Amanda Northern Rd NW
- 7936 Allen Rd
- 10385 Lithopolis Rd NW
- 5726 Bish Rd
- 4656 Meadow Grove Dr NW
- 7591 Heatherwood Dr NW
- 9700 Waterloo Eastern Rd
- 7860 Windsor Ave
- 4410 Pickerington Rd
- 4386 Pickerington Rd
- 4386 Pickerington Rd
- 4480 Pickerington Rd
- 7440 Brandt Rd
- 4435 Pickerington Rd
- 7440 Brandt Rd NW
- 7420 Brandt Rd
- 4525 Pickerington Rd
- 4530 Pickerington Rd
- 7400 Brandt Rd
- 4549 Pickerington Rd
- 4457 Pickerington Rd
- 7445 Brandt Rd
- 4235 Pickerington Rd
- 7435 Winchester Rd
- 7363 Brandt Rd
- 4212 Pickerington Rd
- 7517 Winchester Rd
- 4581 Pickerington Rd