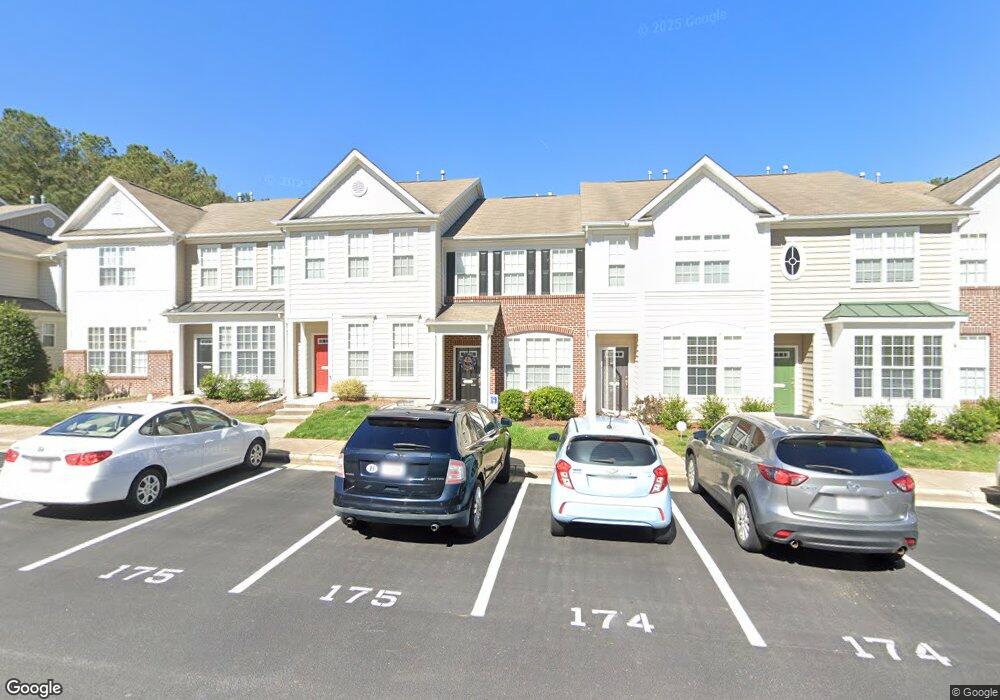
4410 Sugarbend Way Raleigh, NC 27606
South Raleigh NeighborhoodEstimated Value: $315,000 - $321,000
2
Beds
3
Baths
1,471
Sq Ft
$216/Sq Ft
Est. Value
About This Home
This home is located at 4410 Sugarbend Way, Raleigh, NC 27606 and is currently estimated at $318,034, approximately $216 per square foot. 4410 Sugarbend Way is a home located in Wake County with nearby schools including Dillard Drive Magnet Elementary School, Dillard Drive Magnet Middle School, and Adventist Christian Academy of Raleigh.
Ownership History
Date
Name
Owned For
Owner Type
Purchase Details
Closed on
Jul 6, 2016
Sold by
Belcher Joseph A and Belcher Caitlin T
Bought by
Henry Craig and Atcher Charlotte
Current Estimated Value
Purchase Details
Closed on
Feb 21, 2007
Sold by
Reardon Kelly E and Reardon Robert
Bought by
Belcher Joseph A
Home Financials for this Owner
Home Financials are based on the most recent Mortgage that was taken out on this home.
Original Mortgage
$155,000
Interest Rate
6.17%
Mortgage Type
Unknown
Purchase Details
Closed on
Jul 28, 2005
Sold by
Westfield Homes Of The Carolinas Llc
Bought by
Reardon Kelly E and Reardon Robert
Home Financials for this Owner
Home Financials are based on the most recent Mortgage that was taken out on this home.
Original Mortgage
$133,023
Interest Rate
5.59%
Mortgage Type
FHA
Create a Home Valuation Report for This Property
The Home Valuation Report is an in-depth analysis detailing your home's value as well as a comparison with similar homes in the area
Home Values in the Area
Average Home Value in this Area
Purchase History
| Date | Buyer | Sale Price | Title Company |
|---|---|---|---|
| Henry Craig | $175,000 | None Available | |
| Belcher Joseph A | $155,000 | None Available | |
| Reardon Kelly E | $135,000 | -- |
Source: Public Records
Mortgage History
| Date | Status | Borrower | Loan Amount |
|---|---|---|---|
| Previous Owner | Belcher Joseph A | $155,000 | |
| Previous Owner | Reardon Kelly E | $133,023 |
Source: Public Records
Tax History Compared to Growth
Tax History
| Year | Tax Paid | Tax Assessment Tax Assessment Total Assessment is a certain percentage of the fair market value that is determined by local assessors to be the total taxable value of land and additions on the property. | Land | Improvement |
|---|---|---|---|---|
| 2025 | -- | $307,260 | $90,000 | $217,260 |
| 2024 | $2,689 | $307,260 | $90,000 | $217,260 |
| 2023 | $2,300 | $209,164 | $45,000 | $164,164 |
| 2022 | $2,138 | $209,164 | $45,000 | $164,164 |
| 2021 | $2,055 | $209,164 | $45,000 | $164,164 |
| 2020 | $2,018 | $209,164 | $45,000 | $164,164 |
| 2019 | $1,794 | $153,091 | $32,000 | $121,091 |
| 2018 | $1,693 | $153,091 | $32,000 | $121,091 |
| 2017 | $1,613 | $153,091 | $32,000 | $121,091 |
| 2016 | -- | $153,091 | $32,000 | $121,091 |
| 2015 | $1,668 | $159,169 | $32,000 | $127,169 |
| 2014 | $1,583 | $159,169 | $32,000 | $127,169 |
Source: Public Records
Map
Nearby Homes
- 5229 Moonview Ct
- 4510 Sugarbend Way
- 4536 Sugarbend Way
- 5318 Crescentview Pkwy
- 5407 Crescentview Pkwy
- 4511 Pale Moss Dr
- 4513 Pale Moss Dr
- 4538 Pale Moss Dr
- 5569 Sea Daisy Dr
- 4017 Tryon Rd
- 4421 Bridle Run Dr
- 5322 Goldenglow Way
- 4640 Asterwood Dr
- 3977 Amelia Park Dr
- 5333 Olive Rd
- 5228 Olive Rd
- 1929 Fieldhouse Ave
- 2011 Wolfmill Dr Unit 301
- 2505 Goldeneye Ct
- 5119 Orabelle Ct
- 4412 Sugarbend Way
- 4408 Sugarbend Way
- 4406 Sugarbend Way
- 4414 Sugarbend Way
- 4404 Sugarbend Way
- 4402 Sugarbend Way
- 4422 Sugarbend Way
- 5206 Moonview Ct
- 5208 Moonview Ct
- 5202 Moonview Ct
- 4424 Sugarbend Way
- 4426 Sugarbend Way
- 4428 Sugarbend Way
- 4411 Sugarbend Way
- 4407 Sugarbend Way
- 4409 Sugarbend Way
- 4430 Sugarbend Way
- 4405 Sugarbend Way
- 4403 Sugarbend Way
- 4421 Sugarbend Way