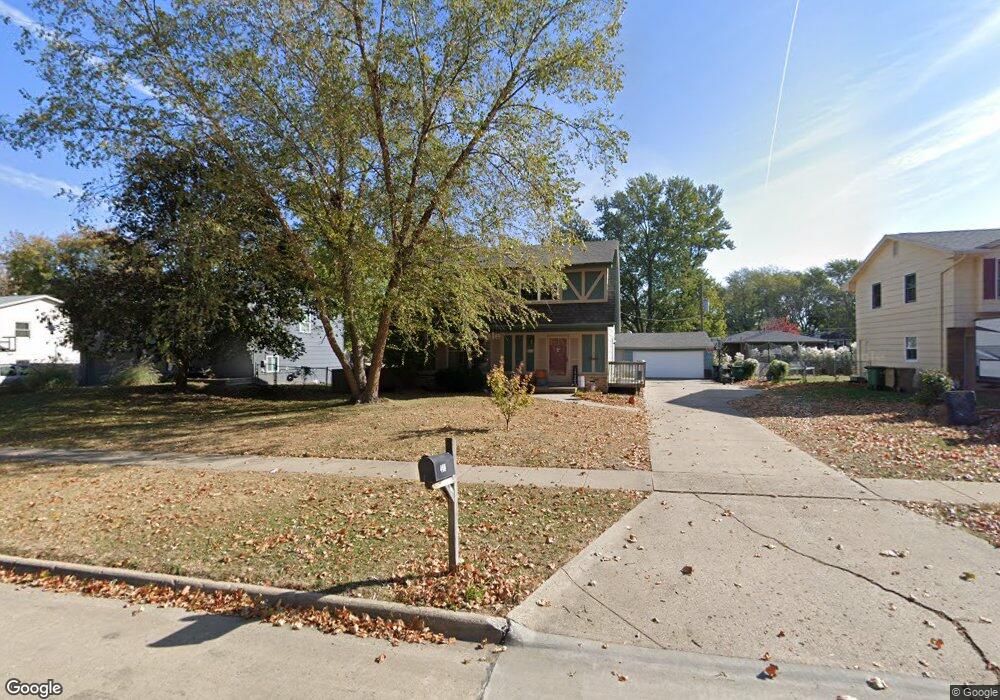
4411 68th St Urbandale, IA 50322
Estimated Value: $301,000 - $310,000
4
Beds
2
Baths
1,470
Sq Ft
$208/Sq Ft
Est. Value
About This Home
This home is located at 4411 68th St, Urbandale, IA 50322 and is currently estimated at $305,741, approximately $207 per square foot. 4411 68th St is a home located in Polk County with nearby schools including Urbandale Middle School, Urbandale High School, and St Pius X School.
Ownership History
Date
Name
Owned For
Owner Type
Purchase Details
Closed on
Aug 21, 2008
Sold by
Boeschen Timothy W and Boeschen Heather M
Bought by
Mau Devon L and Mau Jayme L
Current Estimated Value
Home Financials for this Owner
Home Financials are based on the most recent Mortgage that was taken out on this home.
Original Mortgage
$156,708
Outstanding Balance
$102,751
Interest Rate
6.31%
Mortgage Type
FHA
Estimated Equity
$202,990
Purchase Details
Closed on
Aug 18, 1997
Sold by
Womacks Paul D and Womacks Elizabeth M
Bought by
Boeschen Timothy W and Boeschen Heather M
Home Financials for this Owner
Home Financials are based on the most recent Mortgage that was taken out on this home.
Original Mortgage
$99,800
Interest Rate
7.56%
Create a Home Valuation Report for This Property
The Home Valuation Report is an in-depth analysis detailing your home's value as well as a comparison with similar homes in the area
Home Values in the Area
Average Home Value in this Area
Purchase History
| Date | Buyer | Sale Price | Title Company |
|---|---|---|---|
| Mau Devon L | $157,500 | Itc | |
| Boeschen Timothy W | $111,500 | -- |
Source: Public Records
Mortgage History
| Date | Status | Borrower | Loan Amount |
|---|---|---|---|
| Open | Mau Devon L | $156,708 | |
| Previous Owner | Boeschen Timothy W | $99,800 |
Source: Public Records
Tax History Compared to Growth
Tax History
| Year | Tax Paid | Tax Assessment Tax Assessment Total Assessment is a certain percentage of the fair market value that is determined by local assessors to be the total taxable value of land and additions on the property. | Land | Improvement |
|---|---|---|---|---|
| 2025 | $4,812 | $290,700 | $61,600 | $229,100 |
| 2024 | $4,812 | $276,100 | $57,600 | $218,500 |
| 2023 | $4,520 | $276,100 | $57,600 | $218,500 |
| 2022 | $4,466 | $219,500 | $47,100 | $172,400 |
| 2021 | $4,310 | $219,500 | $47,100 | $172,400 |
| 2020 | $4,234 | $201,500 | $43,200 | $158,300 |
| 2019 | $4,030 | $201,500 | $43,200 | $158,300 |
| 2018 | $3,880 | $183,800 | $38,500 | $145,300 |
| 2017 | $3,606 | $183,800 | $38,500 | $145,300 |
| 2016 | $3,514 | $168,500 | $34,900 | $133,600 |
| 2015 | $3,514 | $168,500 | $34,900 | $133,600 |
| 2014 | $3,232 | $160,500 | $33,200 | $127,300 |
Source: Public Records
Map
Nearby Homes