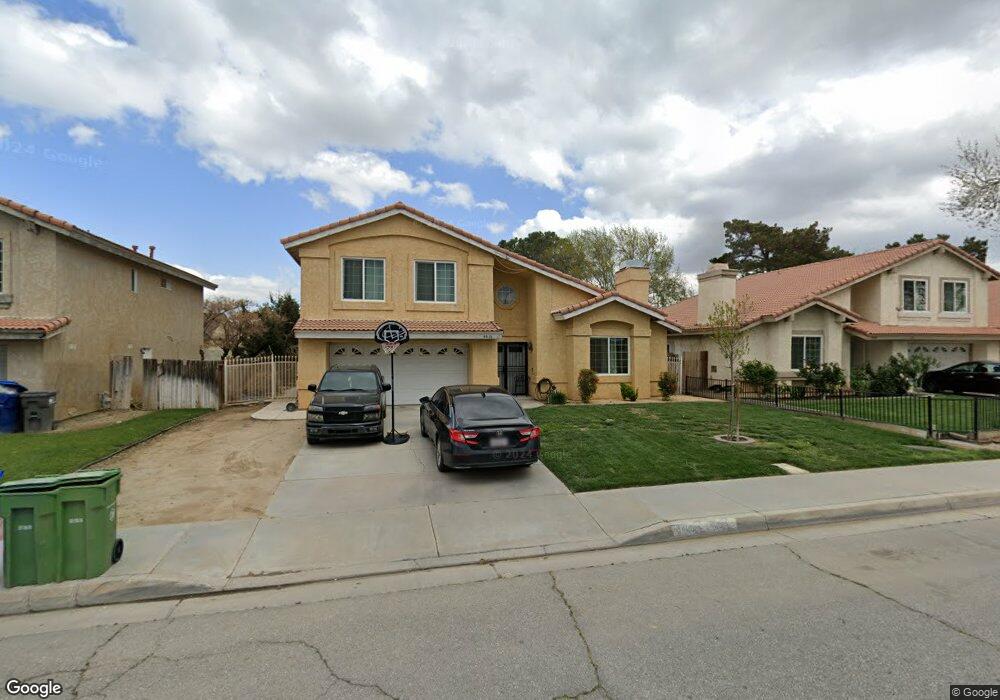
44116 27th St E Lancaster, CA 93535
East Lancaster NeighborhoodEstimated Value: $452,000 - $522,000
4
Beds
3
Baths
2,140
Sq Ft
$226/Sq Ft
Est. Value
About This Home
This home is located at 44116 27th St E, Lancaster, CA 93535 and is currently estimated at $482,805, approximately $225 per square foot. 44116 27th St E is a home located in Los Angeles County with nearby schools including Columbia Elementary School, Gifford C. Cole Middle School, and Eastside High School.
Ownership History
Date
Name
Owned For
Owner Type
Purchase Details
Closed on
Dec 15, 2008
Sold by
Duetsche Bank National Trust Company
Bought by
Robertson Yancy
Current Estimated Value
Home Financials for this Owner
Home Financials are based on the most recent Mortgage that was taken out on this home.
Original Mortgage
$138,077
Outstanding Balance
$90,413
Interest Rate
6.03%
Mortgage Type
FHA
Estimated Equity
$392,392
Purchase Details
Closed on
Jul 2, 2008
Sold by
Turner Ubie B and Turner Brenda L
Bought by
Deutsche Bank National Trust Co and Resmae Asset Backed Pass Through Certifi
Create a Home Valuation Report for This Property
The Home Valuation Report is an in-depth analysis detailing your home's value as well as a comparison with similar homes in the area
Home Values in the Area
Average Home Value in this Area
Purchase History
| Date | Buyer | Sale Price | Title Company |
|---|---|---|---|
| Robertson Yancy | $140,000 | Fidelity National Title Co | |
| Deutsche Bank National Trust Co | $294,740 | None Available |
Source: Public Records
Mortgage History
| Date | Status | Borrower | Loan Amount |
|---|---|---|---|
| Open | Robertson Yancy | $138,077 |
Source: Public Records
Tax History
| Year | Tax Paid | Tax Assessment Tax Assessment Total Assessment is a certain percentage of the fair market value that is determined by local assessors to be the total taxable value of land and additions on the property. | Land | Improvement |
|---|---|---|---|---|
| 2025 | $3,724 | $180,140 | $36,049 | $144,091 |
| 2024 | $3,495 | $176,609 | $35,343 | $141,266 |
| 2023 | $3,395 | $173,147 | $34,650 | $138,497 |
| 2022 | $3,256 | $169,753 | $33,971 | $135,782 |
| 2021 | $2,895 | $166,425 | $33,305 | $133,120 |
| 2020 | $2,859 | $164,720 | $32,964 | $131,756 |
| 2019 | $2,837 | $161,491 | $32,318 | $129,173 |
| 2018 | $2,790 | $158,326 | $31,685 | $126,641 |
| 2016 | $2,660 | $152,179 | $30,455 | $121,724 |
| 2015 | $2,625 | $149,894 | $29,998 | $119,896 |
| 2014 | $2,634 | $146,959 | $29,411 | $117,548 |
Source: Public Records
Map
Nearby Homes
- 44135 Camellia St
- 2745 Garnet Ln
- 44105 Acacia St
- 44232 Begonia St
- 43938 Delgado Ct
- 2559 E Avenue j2
- 110 E Avenue J 8
- 100 E Avenue J 8
- 0 30th St E Unit 25004292
- 43846 Tranquility Ct
- 43846 Estrella Ln
- 3311 Topaz Ln
- 2611 Via Romana
- 2852 San Ramon Dr
- 43823 Tranquility Ct
- 43824 Serenity Ct
- 3103 Emerald Ln
- 3211 E Avenue J 4
- 43749 San Francisco Ave
- 43730 San Francisco Ave
- 44108 27th St E
- 44120 27th St E
- 44115 Dahlia St
- 44109 Dahlia St
- 44123 Dahlia St
- 44102 27th St E
- 44128 27th St E
- 44129 Dahlia St
- 44105 Dahlia St
- 44134 27th St E
- 2703 E Avenue j6
- 2709 E Avenue j6
- 44133 Dahlia St
- 2715 E Avenue j6
- 44140 27th St E
- 44116 Dahlia St
- 2721 E Avenue j6
- 44124 Dahlia St
- 44141 Dahlia St
- 44106 Dahlia St
Your Personal Tour Guide
Ask me questions while you tour the home.