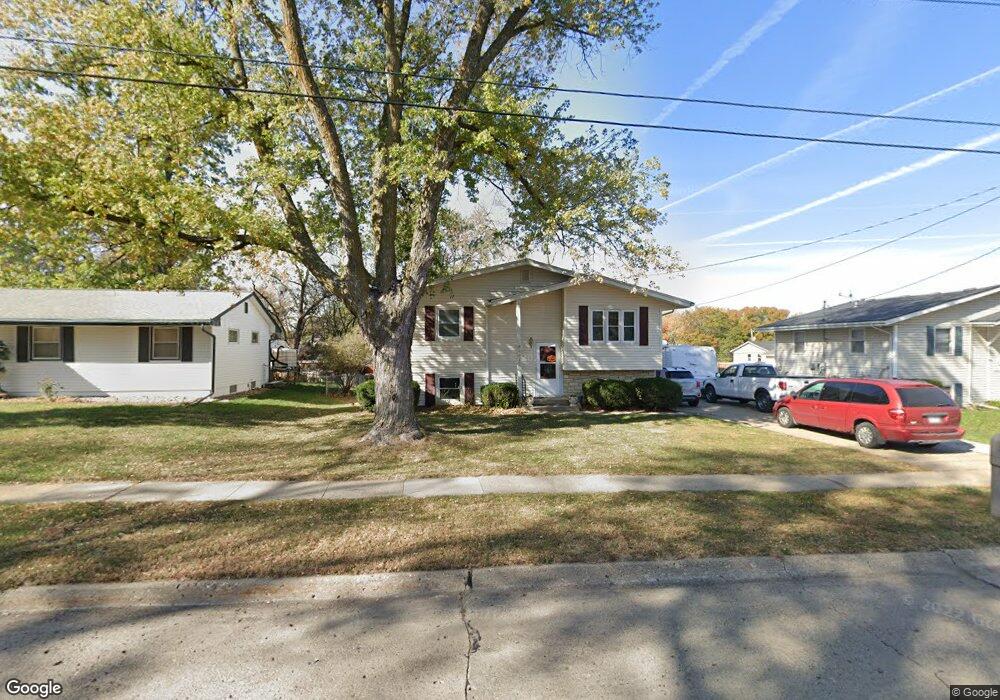
4412 65th St Urbandale, IA 50322
Estimated Value: $243,000 - $284,000
3
Beds
2
Baths
853
Sq Ft
$309/Sq Ft
Est. Value
About This Home
This home is located at 4412 65th St, Urbandale, IA 50322 and is currently estimated at $263,917, approximately $309 per square foot. 4412 65th St is a home located in Polk County with nearby schools including Urbandale Middle School, Urbandale High School, and St Pius X School.
Ownership History
Date
Name
Owned For
Owner Type
Purchase Details
Closed on
Sep 16, 2022
Sold by
Terry Brady
Bought by
Brady Terry and Brady Tonya
Current Estimated Value
Purchase Details
Closed on
Aug 28, 1997
Sold by
Steele Elizabeth Ann
Bought by
Brady Terry J
Home Financials for this Owner
Home Financials are based on the most recent Mortgage that was taken out on this home.
Original Mortgage
$89,965
Interest Rate
7.65%
Create a Home Valuation Report for This Property
The Home Valuation Report is an in-depth analysis detailing your home's value as well as a comparison with similar homes in the area
Home Values in the Area
Average Home Value in this Area
Purchase History
| Date | Buyer | Sale Price | Title Company |
|---|---|---|---|
| Brady Terry | -- | -- | |
| Brady Terry J | $94,500 | -- |
Source: Public Records
Mortgage History
| Date | Status | Borrower | Loan Amount |
|---|---|---|---|
| Previous Owner | Brady Terry J | $89,965 |
Source: Public Records
Tax History Compared to Growth
Tax History
| Year | Tax Paid | Tax Assessment Tax Assessment Total Assessment is a certain percentage of the fair market value that is determined by local assessors to be the total taxable value of land and additions on the property. | Land | Improvement |
|---|---|---|---|---|
| 2025 | $4,062 | $247,200 | $58,600 | $188,600 |
| 2024 | $4,062 | $234,700 | $54,800 | $179,900 |
| 2023 | $3,720 | $234,700 | $54,800 | $179,900 |
| 2022 | $3,674 | $185,600 | $44,800 | $140,800 |
| 2021 | $3,538 | $185,600 | $44,800 | $140,800 |
| 2020 | $3,472 | $170,200 | $41,100 | $129,100 |
| 2019 | $3,300 | $170,200 | $41,100 | $129,100 |
| 2018 | $3,248 | $155,300 | $36,700 | $118,600 |
| 2017 | $3,020 | $155,300 | $36,700 | $118,600 |
| 2016 | $2,942 | $142,500 | $33,300 | $109,200 |
| 2015 | $2,942 | $142,500 | $33,300 | $109,200 |
| 2014 | $2,650 | $133,200 | $30,500 | $102,700 |
Source: Public Records
Map
Nearby Homes