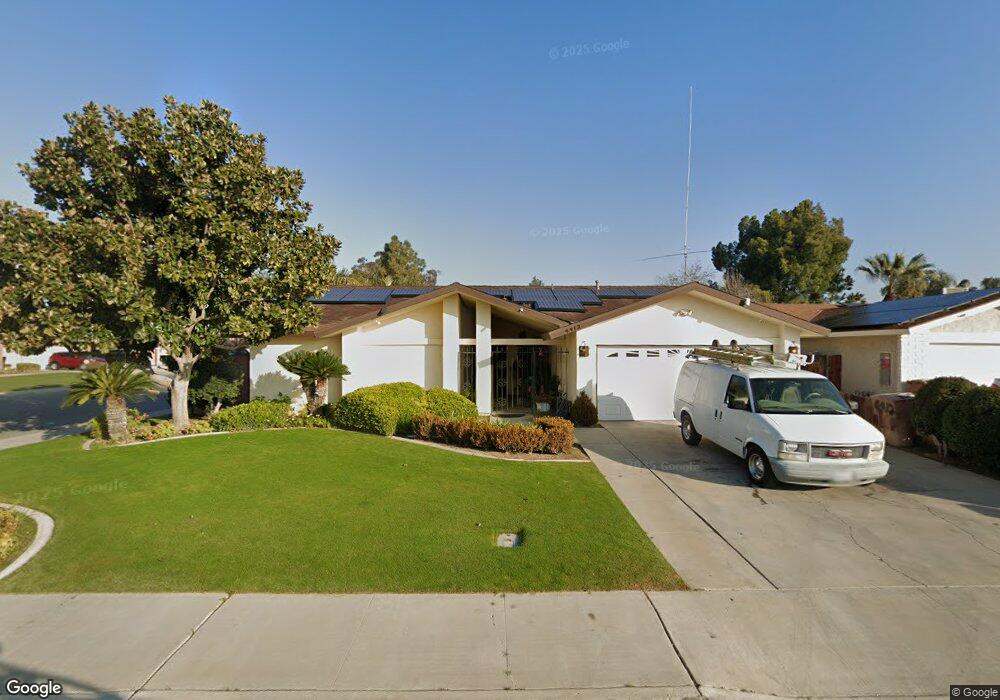
4412 Keith Way Bakersfield, CA 93309
Southwest Bakersfield NeighborhoodEstimated Value: $294,000 - $352,000
4
Beds
2
Baths
1,412
Sq Ft
$236/Sq Ft
Est. Value
About This Home
This home is located at 4412 Keith Way, Bakersfield, CA 93309 and is currently estimated at $333,722, approximately $236 per square foot. 4412 Keith Way is a home located in Kern County with nearby schools including Stine Elementary School, Fred L. Thompson Junior High School, and West High School.
Ownership History
Date
Name
Owned For
Owner Type
Purchase Details
Closed on
Apr 2, 2019
Sold by
Dillard Larry Gene and Larry Gene Dillard Family Trus
Bought by
Dillard Larry Gene
Current Estimated Value
Purchase Details
Closed on
Aug 18, 2012
Sold by
Dillard Julie Gail
Bought by
Dillard Larry Gene and Dillard Julie Gail
Purchase Details
Closed on
Dec 28, 2006
Sold by
Dillard Larry Gene
Bought by
Dillard Julie Gail
Home Financials for this Owner
Home Financials are based on the most recent Mortgage that was taken out on this home.
Original Mortgage
$208,500
Interest Rate
6.16%
Mortgage Type
New Conventional
Purchase Details
Closed on
Dec 1, 2004
Sold by
Dillard Larry Gene and Dillard Julie Gail
Bought by
Dillard Larry Gene and Dillard Julie Gail
Home Financials for this Owner
Home Financials are based on the most recent Mortgage that was taken out on this home.
Original Mortgage
$170,000
Interest Rate
1.25%
Mortgage Type
New Conventional
Create a Home Valuation Report for This Property
The Home Valuation Report is an in-depth analysis detailing your home's value as well as a comparison with similar homes in the area
Home Values in the Area
Average Home Value in this Area
Purchase History
| Date | Buyer | Sale Price | Title Company |
|---|---|---|---|
| Dillard Larry Gene | -- | None Available | |
| Dillard Larry Gene | -- | None Available | |
| Dillard Julie Gail | -- | Financial Title Company | |
| Dillard Larry Gene | -- | -- |
Source: Public Records
Mortgage History
| Date | Status | Borrower | Loan Amount |
|---|---|---|---|
| Closed | Dillard Julie Gail | $208,500 | |
| Closed | Dillard Larry Gene | $170,000 |
Source: Public Records
Tax History Compared to Growth
Tax History
| Year | Tax Paid | Tax Assessment Tax Assessment Total Assessment is a certain percentage of the fair market value that is determined by local assessors to be the total taxable value of land and additions on the property. | Land | Improvement |
|---|---|---|---|---|
| 2025 | $2,897 | $184,802 | $46,892 | $137,910 |
| 2024 | $2,897 | $181,179 | $45,973 | $135,206 |
| 2023 | $2,851 | $177,627 | $45,072 | $132,555 |
| 2022 | $2,736 | $174,145 | $44,189 | $129,956 |
| 2021 | $2,623 | $170,731 | $43,323 | $127,408 |
| 2020 | $2,574 | $168,981 | $42,879 | $126,102 |
| 2019 | $2,541 | $168,981 | $42,879 | $126,102 |
| 2018 | $2,431 | $162,421 | $41,215 | $121,206 |
| 2017 | $2,396 | $159,237 | $40,407 | $118,830 |
| 2016 | $2,248 | $156,115 | $39,615 | $116,500 |
| 2015 | $2,227 | $153,771 | $39,020 | $114,751 |
| 2014 | $2,173 | $150,760 | $38,256 | $112,504 |
Source: Public Records
Map
Nearby Homes
- 3104 Summer Side Ct
- 2808 Edmonton St
- 4608 Posada Ave
- 3900 Rickey Way
- 2608 Hallisey St
- 3813 Rickey Way
- 5001 Appleblossom Dr
- 4162 Pinewood Lake Dr
- 3017 Kennedy Way
- 4165 Pinewood Lake Dr
- 3025 Kennedy Way
- 4517 Meadowlark Way
- 3816 Phaffle Dr
- 2600 Layton Dr
- 3815 Hoffman Ave
- 4136 Pinewood Lake Dr
- 4600 Beechwood St Unit 48
- 4600 Beechwood St Unit 55
- 4600 Beechwood St Unit 80
- 4600 Beechwood St Unit 46