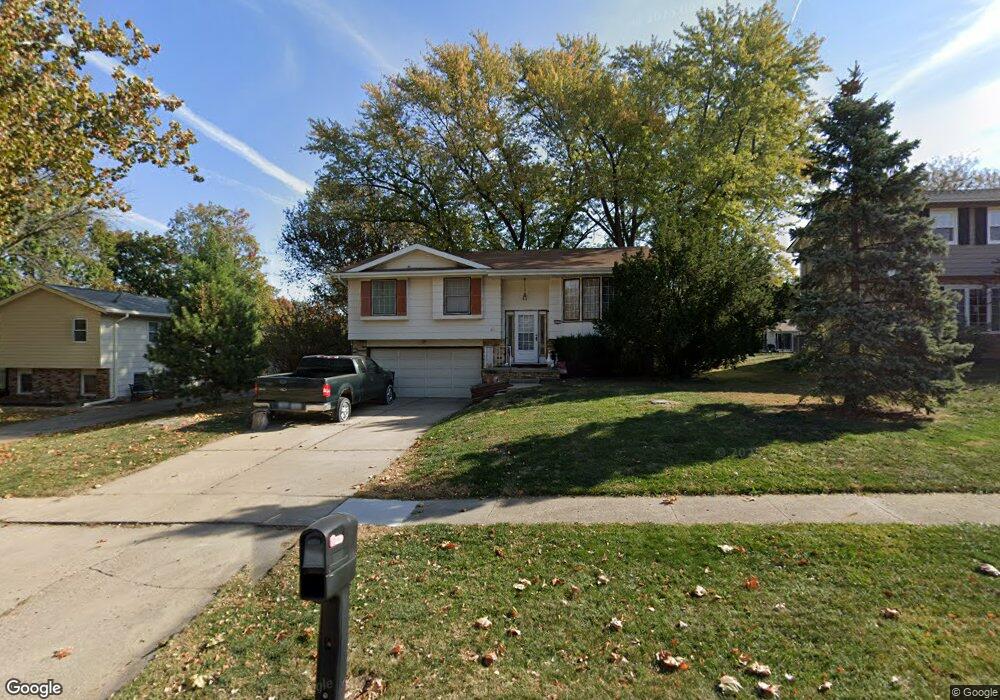
4413 67th St Urbandale, IA 50322
Estimated Value: $261,447 - $283,000
3
Beds
2
Baths
1,073
Sq Ft
$252/Sq Ft
Est. Value
About This Home
This home is located at 4413 67th St, Urbandale, IA 50322 and is currently estimated at $270,112, approximately $251 per square foot. 4413 67th St is a home located in Polk County with nearby schools including Urbandale Middle School, Urbandale High School, and St Pius X School.
Ownership History
Date
Name
Owned For
Owner Type
Purchase Details
Closed on
Apr 10, 2015
Sold by
Estate Of Bettie L Vannausdle
Bought by
Idso Karen A
Current Estimated Value
Home Financials for this Owner
Home Financials are based on the most recent Mortgage that was taken out on this home.
Original Mortgage
$126,100
Outstanding Balance
$96,900
Interest Rate
3.77%
Mortgage Type
FHA
Estimated Equity
$173,212
Purchase Details
Closed on
Aug 20, 2002
Sold by
Jennings Susan A
Bought by
Vannausdle Kenneth W and Vannausdle Bettie L
Purchase Details
Closed on
Sep 25, 1998
Sold by
Jennings Susan A
Bought by
Susan A Jennings Trust
Create a Home Valuation Report for This Property
The Home Valuation Report is an in-depth analysis detailing your home's value as well as a comparison with similar homes in the area
Home Values in the Area
Average Home Value in this Area
Purchase History
| Date | Buyer | Sale Price | Title Company |
|---|---|---|---|
| Idso Karen A | $134,000 | Attorney | |
| Vannausdle Kenneth W | $131,500 | -- | |
| Susan A Jennings Trust | -- | -- |
Source: Public Records
Mortgage History
| Date | Status | Borrower | Loan Amount |
|---|---|---|---|
| Open | Idso Karen A | $126,100 |
Source: Public Records
Tax History Compared to Growth
Tax History
| Year | Tax Paid | Tax Assessment Tax Assessment Total Assessment is a certain percentage of the fair market value that is determined by local assessors to be the total taxable value of land and additions on the property. | Land | Improvement |
|---|---|---|---|---|
| 2025 | $4,232 | $257,000 | $63,200 | $193,800 |
| 2024 | $4,232 | $244,100 | $59,100 | $185,000 |
| 2023 | $3,976 | $244,100 | $59,100 | $185,000 |
| 2022 | $3,928 | $194,200 | $48,300 | $145,900 |
| 2021 | $3,790 | $194,200 | $48,300 | $145,900 |
| 2020 | $3,722 | $178,200 | $44,300 | $133,900 |
| 2019 | $3,538 | $178,200 | $44,300 | $133,900 |
| 2018 | $3,406 | $162,400 | $39,500 | $122,900 |
| 2017 | $3,162 | $162,400 | $39,500 | $122,900 |
| 2016 | $3,080 | $148,800 | $35,900 | $112,900 |
| 2015 | $3,080 | $148,800 | $35,900 | $112,900 |
| 2014 | $3,048 | $137,400 | $32,500 | $104,900 |
Source: Public Records
Map
Nearby Homes