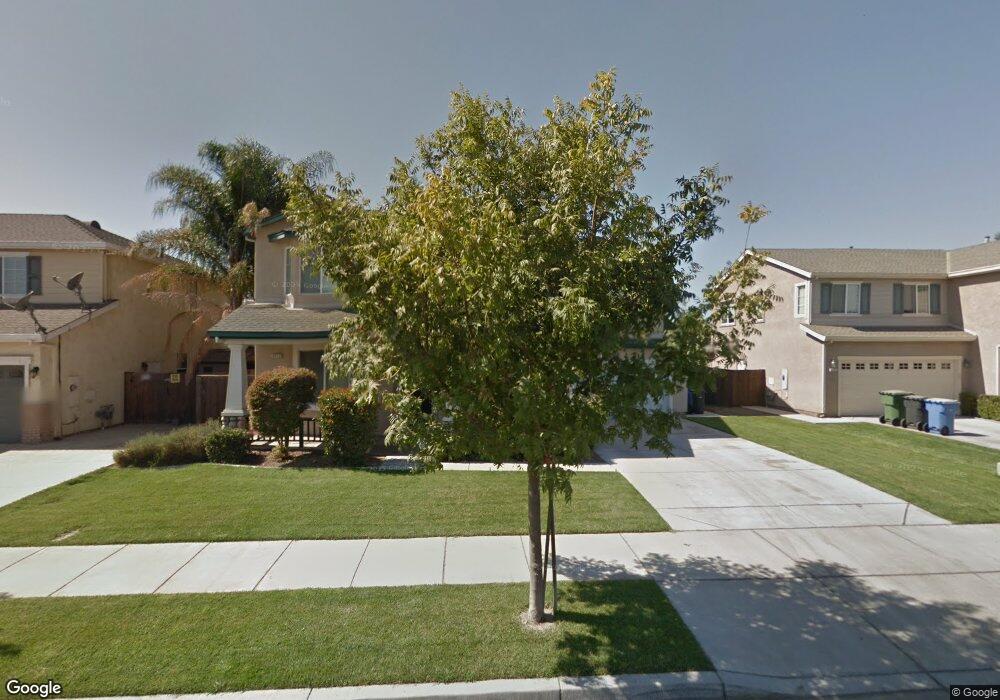
4413 Artisan Way Turlock, CA 95382
Estimated Value: $517,000 - $666,000
5
Beds
3
Baths
2,461
Sq Ft
$247/Sq Ft
Est. Value
About This Home
This home is located at 4413 Artisan Way, Turlock, CA 95382 and is currently estimated at $607,841, approximately $246 per square foot. 4413 Artisan Way is a home located in Stanislaus County with nearby schools including Sandra Tovar Medeiros Elementary School, Turlock Junior High School, and Marvin A. Dutcher Middle School.
Ownership History
Date
Name
Owned For
Owner Type
Purchase Details
Closed on
Oct 23, 2019
Sold by
Peterson Kirk E
Bought by
Peterson Kirk E and Peterson Kimberly Noelle
Current Estimated Value
Home Financials for this Owner
Home Financials are based on the most recent Mortgage that was taken out on this home.
Original Mortgage
$310,500
Outstanding Balance
$272,568
Interest Rate
3.6%
Estimated Equity
$335,273
Purchase Details
Closed on
Oct 5, 2015
Sold by
Peterson Kirk E
Bought by
Peterson Kirk E
Purchase Details
Closed on
Feb 11, 2004
Sold by
North Turlock Llc
Bought by
Peterson Kirk E and Marie Peterson F
Home Financials for this Owner
Home Financials are based on the most recent Mortgage that was taken out on this home.
Original Mortgage
$333,700
Interest Rate
5.85%
Mortgage Type
Purchase Money Mortgage
Create a Home Valuation Report for This Property
The Home Valuation Report is an in-depth analysis detailing your home's value as well as a comparison with similar homes in the area
Home Values in the Area
Average Home Value in this Area
Purchase History
| Date | Buyer | Sale Price | Title Company |
|---|---|---|---|
| Peterson Kirk E | -- | Title365 | |
| Peterson Kirk E | -- | None Available | |
| Peterson Kirk E | $363,000 | Alliance Title Company |
Source: Public Records
Mortgage History
| Date | Status | Borrower | Loan Amount |
|---|---|---|---|
| Open | Peterson Kirk E | $310,500 | |
| Previous Owner | Peterson Kirk E | $333,700 |
Source: Public Records
Tax History Compared to Growth
Tax History
| Year | Tax Paid | Tax Assessment Tax Assessment Total Assessment is a certain percentage of the fair market value that is determined by local assessors to be the total taxable value of land and additions on the property. | Land | Improvement |
|---|---|---|---|---|
| 2025 | $6,222 | $514,683 | $127,953 | $386,730 |
| 2024 | $6,391 | $504,593 | $125,445 | $379,148 |
| 2023 | $6,414 | $494,700 | $122,986 | $371,714 |
| 2022 | $6,329 | $485,001 | $120,575 | $364,426 |
| 2021 | $6,109 | $475,492 | $118,211 | $357,281 |
| 2020 | $5,428 | $414,500 | $140,000 | $274,500 |
| 2019 | $5,387 | $414,500 | $140,000 | $274,500 |
| 2018 | $5,148 | $386,000 | $140,000 | $246,000 |
| 2017 | $4,751 | $356,000 | $120,000 | $236,000 |
| 2016 | $4,538 | $354,000 | $90,000 | $264,000 |
| 2015 | $4,494 | $350,000 | $67,200 | $282,800 |
| 2014 | $4,102 | $312,500 | $60,000 | $252,500 |
Source: Public Records
Map
Nearby Homes
- 1983 Greenfield Dr
- 4325 Alba Ct
- 4320 Panorama Ave
- 4305 Pastoral Ave
- 4205 Moon Rose Ct
- 5201 N Tully Rd
- 1360 Shady Ln Unit 1022
- 1360 Shady Ln Unit 522
- 1360 Shady Ln Unit 923
- 1173 Woodland Dr
- 4591 Sandpiper Cir
- 3884 Paula Ct
- 1062 Ashford Dr
- 4184 Horizon Ct
- 3403 Spring Crest Dr
- 3367 Four Seasons Dr
- 0 W Barnhart Rd Unit 224133814
- 3723 Honeycreeper Dr
- 3300 Spring Garden Dr
- 3293 Dewar Ln
- 4423 Artisan Way
- 4403 Artisan Way
- 4422 Parquet Way
- 4433 Artisan Way
- 4432 Parquet Way
- 4412 Parquet Way
- 2351 Trail Way
- 2352 Caprice Dr
- 4442 Parquet Way
- 4402 Parquet Way
- 2341 Trail Way
- 2342 Caprice Dr
- 2360 Trail Way
- 2350 Trail Way
- 2340 Trail Way
- 2370 Trail Way
- 2331 Trail Way
- 4431 Parquet Way
- 2400 Alta Vista St
- 2332 Caprice Dr