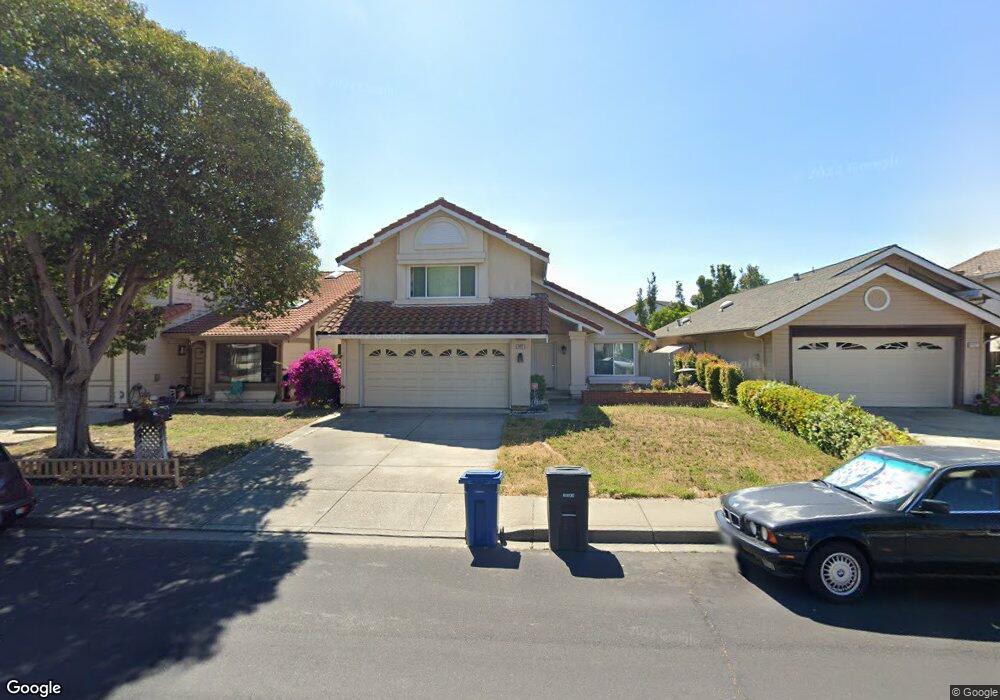
4413 Holt St Union City, CA 94587
Alvarado NeighborhoodEstimated Value: $1,442,285 - $1,481,000
3
Beds
3
Baths
1,683
Sq Ft
$869/Sq Ft
Est. Value
About This Home
This home is located at 4413 Holt St, Union City, CA 94587 and is currently estimated at $1,462,321, approximately $868 per square foot. 4413 Holt St is a home located in Alameda County with nearby schools including Pioneer Elementary School, Itliong-Vera Cruz, and James Logan High School.
Ownership History
Date
Name
Owned For
Owner Type
Purchase Details
Closed on
Feb 11, 2003
Sold by
Hur Phillip C and Hur Diane E
Bought by
Hendon Glen and Duong Hao
Current Estimated Value
Home Financials for this Owner
Home Financials are based on the most recent Mortgage that was taken out on this home.
Original Mortgage
$390,000
Outstanding Balance
$166,296
Interest Rate
5.89%
Estimated Equity
$1,296,025
Purchase Details
Closed on
Jul 22, 1996
Sold by
Ho Phillip C and Ho Diane
Bought by
Hur Phillip C and Hur Diane C
Home Financials for this Owner
Home Financials are based on the most recent Mortgage that was taken out on this home.
Original Mortgage
$192,000
Interest Rate
8.39%
Mortgage Type
Balloon
Purchase Details
Closed on
Jul 19, 1995
Sold by
Tran Ted and Nguyen Thanh Ly
Bought by
Ho Phillip C and Ho Diane
Home Financials for this Owner
Home Financials are based on the most recent Mortgage that was taken out on this home.
Original Mortgage
$196,000
Interest Rate
7.59%
Create a Home Valuation Report for This Property
The Home Valuation Report is an in-depth analysis detailing your home's value as well as a comparison with similar homes in the area
Home Values in the Area
Average Home Value in this Area
Purchase History
| Date | Buyer | Sale Price | Title Company |
|---|---|---|---|
| Hendon Glen | $490,000 | First American Title Company | |
| Hur Phillip C | -- | Chicago Title Co | |
| Ho Phillip C | $245,000 | Fidelity National Title |
Source: Public Records
Mortgage History
| Date | Status | Borrower | Loan Amount |
|---|---|---|---|
| Open | Hendon Glen | $390,000 | |
| Previous Owner | Hur Phillip C | $192,000 | |
| Previous Owner | Ho Phillip C | $196,000 |
Source: Public Records
Tax History Compared to Growth
Tax History
| Year | Tax Paid | Tax Assessment Tax Assessment Total Assessment is a certain percentage of the fair market value that is determined by local assessors to be the total taxable value of land and additions on the property. | Land | Improvement |
|---|---|---|---|---|
| 2025 | $10,046 | $702,617 | $212,885 | $496,732 |
| 2024 | $10,046 | $688,706 | $208,712 | $486,994 |
| 2023 | $9,711 | $682,070 | $204,621 | $477,449 |
| 2022 | $9,573 | $661,697 | $200,609 | $468,088 |
| 2021 | $9,324 | $648,590 | $196,677 | $458,913 |
| 2020 | $9,291 | $648,871 | $194,661 | $454,210 |
| 2019 | $9,231 | $636,151 | $190,845 | $445,306 |
| 2018 | $9,009 | $623,681 | $187,104 | $436,577 |
| 2017 | $8,820 | $611,455 | $183,436 | $428,019 |
| 2016 | $8,622 | $599,470 | $179,841 | $419,629 |
| 2015 | $8,519 | $590,468 | $177,140 | $413,328 |
| 2014 | $8,164 | $578,904 | $173,671 | $405,233 |
Source: Public Records
Map
Nearby Homes
- 4532 Delores Dr
- 4231 Hanford St
- 34102 Zaner Way
- 4272 Warbler Loop
- 4611 Carmen Way
- 32451 Regents Blvd
- 4243 Comet Cir
- 4639 Michelle Ct
- 32945 Regents Blvd
- 4201 Saturn Way
- 4214 Saturn Way
- 4506 Birchwood Ct
- 32542 Lake Tana St
- 32409 Elizabeth Way
- 33162 Lake Pyramid St
- 4100 Aquarius Cir
- 33018 Soquel St
- 4141 Deep Creek Rd Unit 137
- 33283 Sunriver Common
- 33228 Jamie Cir