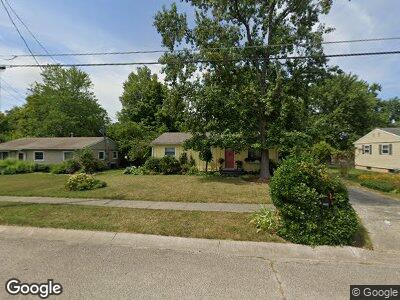
4413 Wiborg Dr Cincinnati, OH 45244
Mount Carmel NeighborhoodEstimated Value: $213,293 - $242,000
3
Beds
2
Baths
1,000
Sq Ft
$229/Sq Ft
Est. Value
About This Home
This home is located at 4413 Wiborg Dr, Cincinnati, OH 45244 and is currently estimated at $228,573, approximately $228 per square foot. 4413 Wiborg Dr is a home located in Clermont County with nearby schools including Summerside Elementary School, West Clermont Middle School, and West Clermont High School.
Ownership History
Date
Name
Owned For
Owner Type
Purchase Details
Closed on
Aug 19, 2011
Sold by
Kilgore Marlin Thomas and Kilgore Constance June
Bought by
Kilgore Marilin Thomas and Kilgore Constance June
Current Estimated Value
Create a Home Valuation Report for This Property
The Home Valuation Report is an in-depth analysis detailing your home's value as well as a comparison with similar homes in the area
Home Values in the Area
Average Home Value in this Area
Purchase History
| Date | Buyer | Sale Price | Title Company |
|---|---|---|---|
| Kilgore Marilin Thomas | -- | None Available |
Source: Public Records
Tax History Compared to Growth
Tax History
| Year | Tax Paid | Tax Assessment Tax Assessment Total Assessment is a certain percentage of the fair market value that is determined by local assessors to be the total taxable value of land and additions on the property. | Land | Improvement |
|---|---|---|---|---|
| 2024 | $2,169 | $52,820 | $9,240 | $43,580 |
| 2023 | $2,204 | $52,820 | $9,240 | $43,580 |
| 2022 | $1,937 | $42,000 | $7,350 | $34,650 |
| 2021 | $1,946 | $42,000 | $7,350 | $34,650 |
| 2020 | $1,947 | $42,000 | $7,350 | $34,650 |
| 2019 | $1,317 | $35,040 | $7,140 | $27,900 |
| 2018 | $1,330 | $35,040 | $7,140 | $27,900 |
| 2017 | $1,348 | $35,040 | $7,140 | $27,900 |
| 2016 | $1,431 | $34,340 | $7,000 | $27,340 |
| 2015 | $1,388 | $34,340 | $7,000 | $27,340 |
| 2014 | $1,388 | $34,340 | $7,000 | $27,340 |
| 2013 | $1,293 | $32,340 | $8,400 | $23,940 |
Source: Public Records
Map
Nearby Homes
- 453 Bornholm Place
- 8681 Glenrose Ln
- 2326 Heather Hill Blvd N
- 4301 Brisco Ct
- 8418 Clough Pike
- 607 Tradition Ridge
- 615 Tradition Ridge
- 617 Tradition Ridge
- 623 Tradition Ridge
- 635 Tradition Ridge
- 587 Dedication Ln
- 639 Tradition Ridge
- 649 Tradition Ridge
- 657 Tradition Ridge
- 655 Tradition Ridge
- 489 Roney Ln
- 1806 Muskegon Dr
- 4255 Bantam Ln
- 482 Sanctuary Way
- 471 Sanctuary Way
- 4413 Wiborg Dr
- 4411 Wiborg Dr
- 4415 Wiborg Dr
- 7.500ac Wiborg Dr
- 251 Wiborg Dr
- 4412 Wiborg Dr
- 4417 Wiborg Dr
- 4405 Wiborg Dr
- 4410 Wiborg Dr
- 434 Odin Dr
- 443 Bornholm Place
- 442 Bornholm Place
- 4419 Wiborg Dr
- 430 Odin Dr
- 4381 Wiborg Dr
- 440 Odin Dr
- 447 Bornholm Place
- 444 Bornholm Place
- 2534 Teuton Ct
- 4423 Wiborg Dr