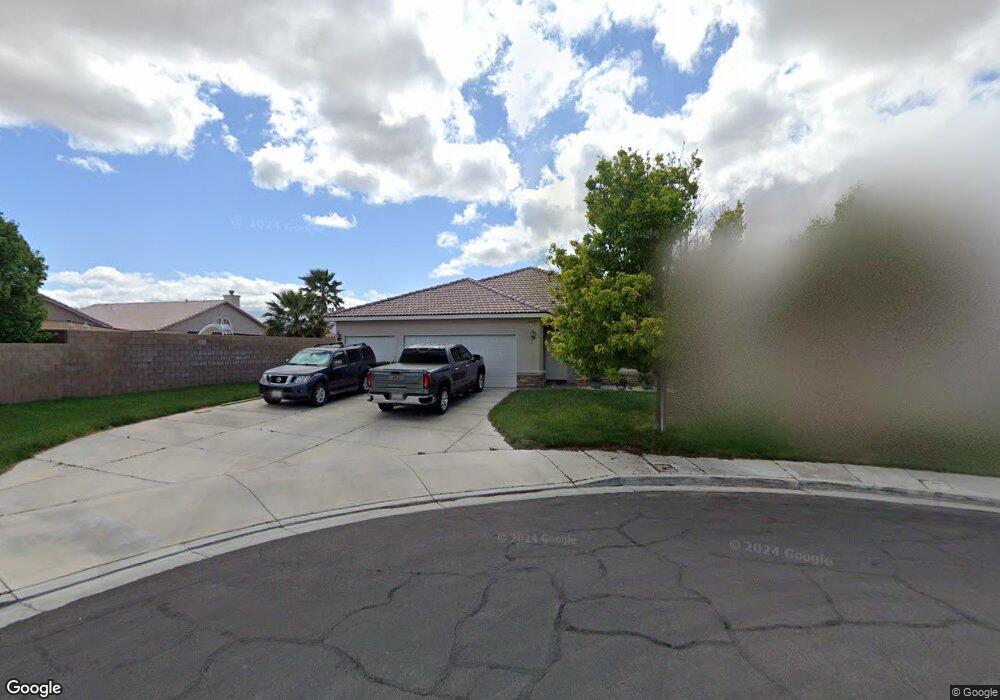
44137 Dawn Ct Lancaster, CA 93536
West Lancaster NeighborhoodEstimated Value: $533,000 - $579,000
4
Beds
2
Baths
2,204
Sq Ft
$250/Sq Ft
Est. Value
About This Home
This home is located at 44137 Dawn Ct, Lancaster, CA 93536 and is currently estimated at $550,809, approximately $249 per square foot. 44137 Dawn Ct is a home located in Los Angeles County with nearby schools including West Wind Elementary School, Endeavour Middle School, and Lancaster High School.
Ownership History
Date
Name
Owned For
Owner Type
Purchase Details
Closed on
Aug 28, 2009
Sold by
Deutsche Bank National Trust Company
Bought by
Vandermark Rebekah K
Current Estimated Value
Purchase Details
Closed on
Jun 4, 2009
Sold by
Washington Patricia and Washington Reginald
Bought by
Deutsche Bank National Trust Company
Purchase Details
Closed on
Aug 10, 2006
Sold by
Washington Patricia and Washington Reginald
Bought by
Washington Reginald and Washington Patricia
Home Financials for this Owner
Home Financials are based on the most recent Mortgage that was taken out on this home.
Original Mortgage
$336,000
Interest Rate
6.17%
Mortgage Type
Purchase Money Mortgage
Purchase Details
Closed on
Aug 1, 2005
Sold by
Cdr Iv Llc
Bought by
Washington Reginald and Washington Patricia
Home Financials for this Owner
Home Financials are based on the most recent Mortgage that was taken out on this home.
Original Mortgage
$367,500
Interest Rate
7.75%
Mortgage Type
Fannie Mae Freddie Mac
Create a Home Valuation Report for This Property
The Home Valuation Report is an in-depth analysis detailing your home's value as well as a comparison with similar homes in the area
Home Values in the Area
Average Home Value in this Area
Purchase History
| Date | Buyer | Sale Price | Title Company |
|---|---|---|---|
| Vandermark Rebekah K | $204,000 | Fidelity National Title | |
| Deutsche Bank National Trust Company | $160,000 | Accommodation | |
| Washington Reginald | -- | First American Title Company | |
| Washington Reginald | $367,500 | -- |
Source: Public Records
Mortgage History
| Date | Status | Borrower | Loan Amount |
|---|---|---|---|
| Previous Owner | Washington Reginald | $336,000 | |
| Previous Owner | Washington Reginald | $367,500 |
Source: Public Records
Tax History Compared to Growth
Tax History
| Year | Tax Paid | Tax Assessment Tax Assessment Total Assessment is a certain percentage of the fair market value that is determined by local assessors to be the total taxable value of land and additions on the property. | Land | Improvement |
|---|---|---|---|---|
| 2025 | $4,581 | $263,313 | $65,825 | $197,488 |
| 2024 | $4,581 | $258,151 | $64,535 | $193,616 |
| 2023 | $4,487 | $253,090 | $63,270 | $189,820 |
| 2022 | $4,275 | $248,129 | $62,030 | $186,099 |
| 2021 | $3,870 | $243,264 | $60,814 | $182,450 |
| 2019 | $3,761 | $236,051 | $59,011 | $177,040 |
| 2018 | $3,695 | $231,423 | $57,854 | $173,569 |
| 2016 | $3,497 | $222,438 | $55,608 | $166,830 |
| 2015 | $3,453 | $219,098 | $54,773 | $164,325 |
| 2014 | $3,335 | $208,000 | $52,100 | $155,900 |
Source: Public Records
Map
Nearby Homes
- 44149 Westridge Dr
- 4061 Avenue j7
- 44304 43rd St W
- 1 44th St
- 44014 42nd St W
- 4011 Dee Ct
- 4244 W Avenue J
- 43929 44th St W
- 43939 Moccasin Place
- 0 40th St W Unit OC25055748
- 0 40th St W Unit 24007984
- 0 40th St W Unit PW24197213
- 4557 W Avenue j5
- 44365 Nolina Cir
- 43890 Moccasin Place
- 44273 Palo Verde St
- 4624 W Avenue j5
- 0 43rd Street West and Pillsbury Unit 24004701
- 4651 W Avenue j3
- 0 47th St W
- 44143 Dawn Ct
- 4151 W Avenue j6
- 4157 W Avenue j6
- 44149 Dawn Ct
- 4145 W Avenue j6
- 44136 Dawn Ct
- 44155 Dawn Ct
- 44150 Dawn Ct
- 4133 W Avenue j6
- 44161 Dawn Ct
- 44156 Dawn Ct
- 4127 W Avenue j6
- 4156 W Avenue j6
- 4150 W Avenue j6
- 4156 W Avenue J-6
- 44162 Dawn Ct
- 4156 W Avenue j6
- 44143 Vintage St
- 44137 Vintage St
- 4144 W Avenue j6