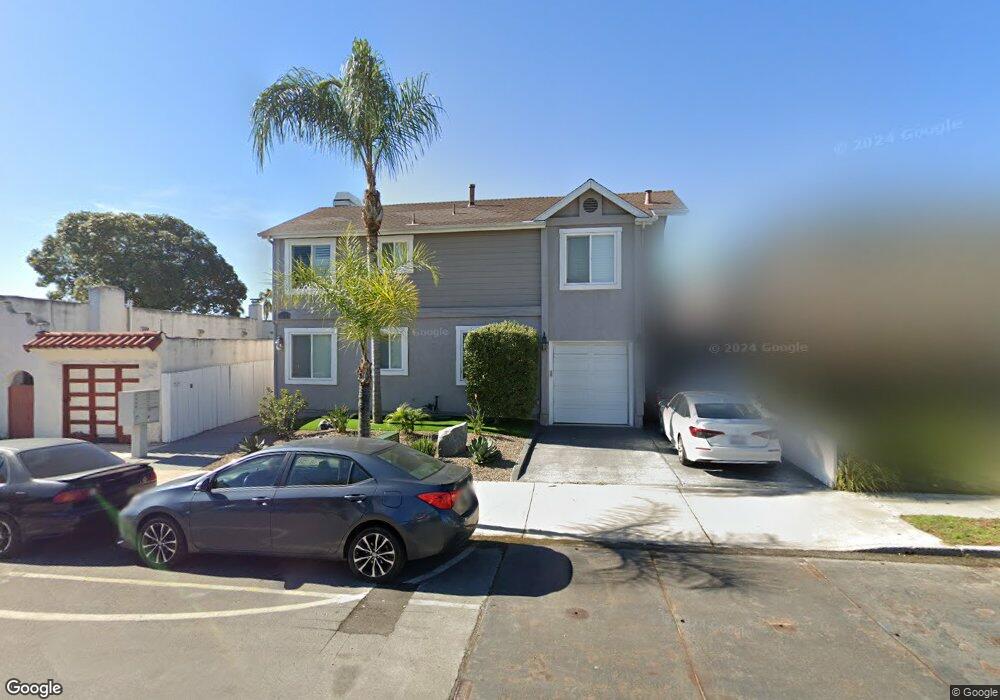
4414 39th St Unit 2 San Diego, CA 92116
Normal Heights NeighborhoodEstimated Value: $471,000 - $585,000
2
Beds
2
Baths
900
Sq Ft
$600/Sq Ft
Est. Value
About This Home
This home is located at 4414 39th St Unit 2, San Diego, CA 92116 and is currently estimated at $539,849, approximately $599 per square foot. 4414 39th St Unit 2 is a home located in San Diego County with nearby schools including Normal Heights Elementary, Wilson Middle School, and Herbert Hoover High School.
Ownership History
Date
Name
Owned For
Owner Type
Purchase Details
Closed on
Dec 11, 2015
Sold by
Deal Jason and Italiano Lacy
Bought by
Jimenez Erika Alfonsina Rico
Current Estimated Value
Purchase Details
Closed on
Mar 16, 2014
Sold by
Deal Jason and Italiano Lacy
Bought by
Deal Jason
Purchase Details
Closed on
Sep 11, 2009
Sold by
Guiliani Wayne
Bought by
Deal Jason and Italiano Lacy
Home Financials for this Owner
Home Financials are based on the most recent Mortgage that was taken out on this home.
Original Mortgage
$211,105
Interest Rate
5.25%
Mortgage Type
FHA
Purchase Details
Closed on
Jan 26, 2005
Sold by
4414 39Th Llc
Bought by
Guiliani Wayne R
Home Financials for this Owner
Home Financials are based on the most recent Mortgage that was taken out on this home.
Original Mortgage
$299,920
Interest Rate
5.37%
Mortgage Type
FHA
Create a Home Valuation Report for This Property
The Home Valuation Report is an in-depth analysis detailing your home's value as well as a comparison with similar homes in the area
Home Values in the Area
Average Home Value in this Area
Purchase History
We collect this data history from publicly available records. To have your information removed, we recommend requesting removal directly through your county’s website.
| Date | Buyer | Sale Price | Title Company |
|---|---|---|---|
| Jimenez Erika Alfonsina Rico | $288,000 | First American Title Company | |
| Deal Jason | -- | None Available | |
| Deal Jason | $215,000 | Ticor Title Company | |
| Guiliani Wayne R | $375,000 | First American Title |
Source: Public Records
Mortgage History
We collect this data history from publicly available records. To have your information removed, we recommend requesting removal directly through your county’s website.
| Date | Status | Borrower | Loan Amount |
|---|---|---|---|
| Previous Owner | Deal Jason | $211,105 | |
| Previous Owner | Guiliani Wayne R | $299,920 | |
| Closed | Guiliani Wayne R | $37,490 |
Source: Public Records
Tax History
| Year | Tax Paid | Tax Assessment Tax Assessment Total Assessment is a certain percentage of the fair market value that is determined by local assessors to be the total taxable value of land and additions on the property. | Land | Improvement |
|---|---|---|---|---|
| 2025 | $4,051 | $340,925 | $174,427 | $166,498 |
| 2024 | $4,051 | $334,241 | $171,007 | $163,234 |
| 2023 | $3,960 | $327,688 | $167,654 | $160,034 |
| 2022 | $3,853 | $321,264 | $164,367 | $156,897 |
| 2021 | $3,825 | $314,966 | $161,145 | $153,821 |
| 2020 | $3,778 | $311,737 | $159,493 | $152,244 |
| 2019 | $3,709 | $305,625 | $156,366 | $149,259 |
| 2018 | $3,467 | $299,633 | $153,300 | $146,333 |
| 2017 | $3,384 | $293,759 | $150,295 | $143,464 |
| 2016 | $3,328 | $288,000 | $147,349 | $140,651 |
| 2015 | $2,740 | $230,912 | $118,141 | $112,771 |
| 2014 | $2,615 | $226,389 | $115,827 | $110,562 |
Source: Public Records
Map
Nearby Homes
- 4416 40th St
- 4411 Mcclintock St
- 4367 Mcclintock St
- 4414 37th St
- 4081 Meade Ave
- 3676 Monroe Ave
- 4455 41st St
- 4226 40th St
- 4220-22 40th St
- 4210 40th St
- 4204 40th St
- 4236-1/2 41st St
- 4444 42nd St
- 4166 Monroe Ave
- 4244 Cherokee Ave Unit 4
- 4265-67 36th St
- 4365-67 Wilson Ave
- 4524 Wilson Ave Unit 201
- 3532 Meade Ave Unit 28
- 4152 Orange Ave
- 4414 39th St Unit 6
- 4414 39th St Unit 4
- 4414 39th St Unit 7
- 4414 39th St Unit 5
- 4414 39th St Unit 3
- 3836 Meade Ave
- 4422 39th St Unit 4
- 4422 39th St
- 3844 Meade Ave
- 3828 Meade Ave
- 4428 39th St
- 4428-30 39th St
- 3818 Meade Ave
- 3812 Meade Ave
- 4415 38th St
- 4415 38th St Unit 12
- 4415 38th St Unit 1
- 4415 38th St Unit 11
- 4415 38th St Unit 10
- 4415 38th St Unit 9
Your Personal Tour Guide
Ask me questions while you tour the home.