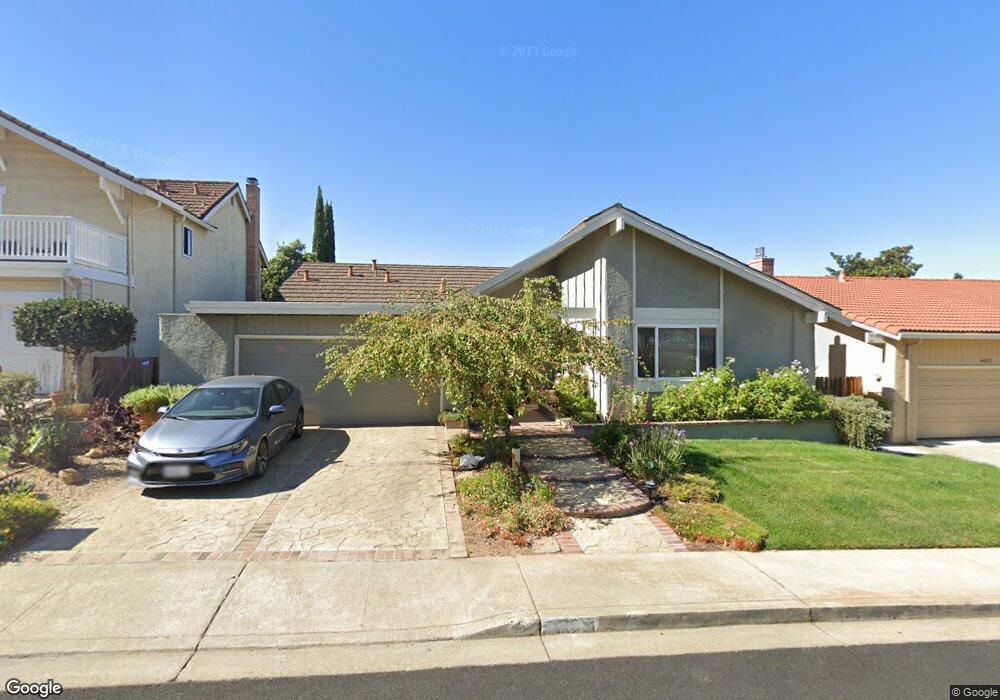
4414 Red Maple Ct Concord, CA 94521
Midtown Concord NeighborhoodEstimated Value: $868,810 - $966,000
3
Beds
2
Baths
1,641
Sq Ft
$565/Sq Ft
Est. Value
About This Home
This home is located at 4414 Red Maple Ct, Concord, CA 94521 and is currently estimated at $926,703, approximately $564 per square foot. 4414 Red Maple Ct is a home located in Contra Costa County with nearby schools including Highlands Elementary School, Mt. Diablo Elementary School, and Foothill Middle School.
Ownership History
Date
Name
Owned For
Owner Type
Purchase Details
Closed on
Oct 12, 2011
Sold by
Delony Timothy E and Delony Tracy M
Bought by
Delony Timothy E and Delony Tracy M
Current Estimated Value
Purchase Details
Closed on
Jun 21, 2001
Sold by
Delony Tracy Melinda and Howard Tracy M
Bought by
Delony Timothy Edwin and Delony Tracy Melinda
Home Financials for this Owner
Home Financials are based on the most recent Mortgage that was taken out on this home.
Original Mortgage
$165,000
Interest Rate
7%
Mortgage Type
Purchase Money Mortgage
Purchase Details
Closed on
Nov 3, 1995
Sold by
Howard Tracy M
Bought by
Howard Tracy M
Home Financials for this Owner
Home Financials are based on the most recent Mortgage that was taken out on this home.
Original Mortgage
$119,000
Interest Rate
7.62%
Mortgage Type
Purchase Money Mortgage
Purchase Details
Closed on
Dec 15, 1993
Sold by
Howard Mark W
Bought by
Howard Tracy M
Create a Home Valuation Report for This Property
The Home Valuation Report is an in-depth analysis detailing your home's value as well as a comparison with similar homes in the area
Home Values in the Area
Average Home Value in this Area
Purchase History
| Date | Buyer | Sale Price | Title Company |
|---|---|---|---|
| Delony Timothy E | -- | None Available | |
| Delony Timothy E | -- | None Available | |
| Delony Timothy Edwin | -- | American Title Co | |
| Howard Tracy M | -- | North American Title Co | |
| Howard Tracy M | -- | -- |
Source: Public Records
Mortgage History
| Date | Status | Borrower | Loan Amount |
|---|---|---|---|
| Closed | Delony Timothy Edwin | $165,000 | |
| Closed | Howard Tracy M | $119,000 |
Source: Public Records
Tax History
| Year | Tax Paid | Tax Assessment Tax Assessment Total Assessment is a certain percentage of the fair market value that is determined by local assessors to be the total taxable value of land and additions on the property. | Land | Improvement |
|---|---|---|---|---|
| 2025 | $3,933 | $277,627 | $85,286 | $192,341 |
| 2024 | $3,726 | $272,184 | $83,614 | $188,570 |
| 2023 | $3,726 | $266,848 | $81,975 | $184,873 |
| 2022 | $3,656 | $261,617 | $80,368 | $181,249 |
| 2021 | $3,551 | $256,489 | $78,793 | $177,696 |
| 2019 | $3,468 | $248,883 | $76,457 | $172,426 |
| 2018 | $3,324 | $244,004 | $74,958 | $169,046 |
| 2017 | $3,199 | $239,221 | $73,489 | $165,732 |
| 2016 | $3,087 | $234,532 | $72,049 | $162,483 |
| 2015 | $3,028 | $231,010 | $70,967 | $160,043 |
| 2014 | $3,018 | $226,485 | $69,577 | $156,908 |
Source: Public Records
Map
Nearby Homes
- 4497 Wildberry Ct
- 4317 Cowell Rd
- 1200 Stonecrest Ln
- 4362 Lynn Dr
- 5324 Swainsons Ct
- 5244 S Montecito Dr
- 4040 Davenport Ln
- 1358 Swallowtail Rd
- 4275 Marietta Ct
- 4151 Storey Ln
- 1430 Bel Air Dr Unit 305
- 1430 Bel Air Dr Unit 103
- 4252 El Cerrito Rd
- 1450 Bel Air Dr Unit 110
- 4130 Storey Ln
- 4225 Sherwood Ct
- 4417 Catalpa Ct
- 4632 Melody Dr Unit E
- 4044 Cowell Rd
- 1025 Pinehurst Ct
- 4416 Red Maple Ct
- 4412 Red Maple Ct
- 4415 Water Oak Ct
- 4413 Water Oak Ct
- 4417 Water Oak Ct
- 4410 Red Maple Ct
- 4418 Red Maple Ct
- 4415 Red Maple Ct
- 4411 Water Oak Ct
- 4417 Red Maple Ct
- 4413 Red Maple Ct
- 4419 Water Oak Ct
- 4420 Red Maple Ct
- 4408 Red Maple Ct
- 4419 Red Maple Ct
- 4409 Water Oak Ct
- 4411 Red Maple Ct
- 4421 Red Maple Ct
- 4414 Shellbark Ct
- 4412 Water Oak Ct
Your Personal Tour Guide
Ask me questions while you tour the home.