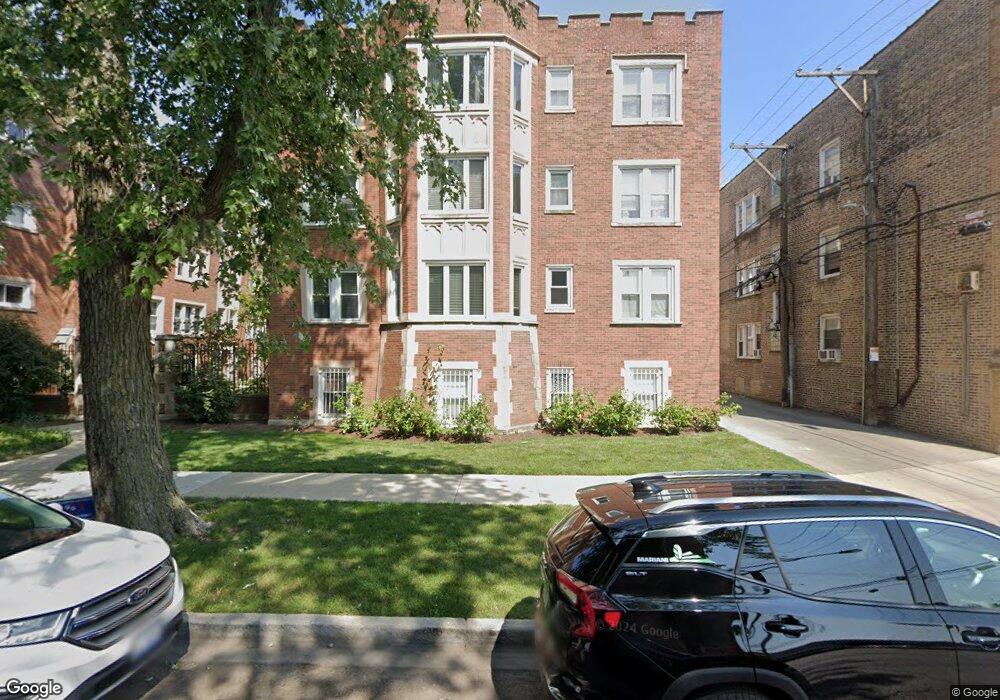
4415 N Lawndale Ave Unit 44151 Chicago, IL 60625
Albany Park NeighborhoodEstimated Value: $246,505 - $295,000
2
Beds
1
Bath
--
Sq Ft
0.36
Acres
About This Home
This home is located at 4415 N Lawndale Ave Unit 44151, Chicago, IL 60625 and is currently estimated at $263,876. 4415 N Lawndale Ave Unit 44151 is a home located in Cook County with nearby schools including Haugan Elementary School, Roosevelt High School, and ASPIRA Haugan Middle School.
Ownership History
Date
Name
Owned For
Owner Type
Purchase Details
Closed on
Mar 14, 2014
Sold by
Ahn Eujin and Ahn Cynthia
Bought by
Olson Valerie J
Current Estimated Value
Home Financials for this Owner
Home Financials are based on the most recent Mortgage that was taken out on this home.
Original Mortgage
$115,650
Outstanding Balance
$89,003
Interest Rate
4.75%
Mortgage Type
New Conventional
Estimated Equity
$174,873
Purchase Details
Closed on
Mar 2, 2006
Sold by
Jin Ho Kwon Trust
Bought by
Ahn Eujin and Ahn Cynthia
Home Financials for this Owner
Home Financials are based on the most recent Mortgage that was taken out on this home.
Original Mortgage
$160,000
Interest Rate
6.33%
Mortgage Type
Unknown
Purchase Details
Closed on
Feb 22, 2003
Sold by
Kwon Jin H
Bought by
Kwon Jin Ho and Jin Ho Kwon Declaration Of Trust
Purchase Details
Closed on
Jul 11, 2001
Sold by
Chicago Title Land Trust Company
Bought by
Kwon Jin H
Create a Home Valuation Report for This Property
The Home Valuation Report is an in-depth analysis detailing your home's value as well as a comparison with similar homes in the area
Home Values in the Area
Average Home Value in this Area
Purchase History
| Date | Buyer | Sale Price | Title Company |
|---|---|---|---|
| Olson Valerie J | $128,500 | Pntn | |
| Ahn Eujin | $190,000 | Multiple | |
| Kwon Jin Ho | -- | -- | |
| Kwon Jin H | $149,500 | -- |
Source: Public Records
Mortgage History
| Date | Status | Borrower | Loan Amount |
|---|---|---|---|
| Open | Olson Valerie J | $115,650 | |
| Previous Owner | Ahn Eujin | $160,000 |
Source: Public Records
Tax History Compared to Growth
Tax History
| Year | Tax Paid | Tax Assessment Tax Assessment Total Assessment is a certain percentage of the fair market value that is determined by local assessors to be the total taxable value of land and additions on the property. | Land | Improvement |
|---|---|---|---|---|
| 2024 | $2,897 | $19,636 | $1,864 | $17,772 |
| 2023 | $2,803 | $17,000 | $1,491 | $15,509 |
| 2022 | $2,803 | $17,000 | $1,491 | $15,509 |
| 2021 | $2,758 | $16,999 | $1,491 | $15,508 |
| 2020 | $2,019 | $12,136 | $772 | $11,364 |
| 2019 | $2,050 | $13,600 | $772 | $12,828 |
| 2018 | $2,014 | $13,600 | $772 | $12,828 |
| 2017 | $1,815 | $11,780 | $692 | $11,088 |
| 2016 | $2,367 | $11,780 | $692 | $11,088 |
| 2015 | $2,166 | $11,780 | $692 | $11,088 |
| 2014 | $1,575 | $11,029 | $639 | $10,390 |
| 2013 | $1,533 | $11,029 | $639 | $10,390 |
Source: Public Records
Map
Nearby Homes
- 3733 W Sunnyside Ave
- 3550 W Montrose Ave Unit 107
- 4426 N Drake Ave
- 4304 N Lawndale Ave
- 4515 N Hamlin Ave
- 3707 W Cullom Ave Unit 1
- 3816 W Montrose Ave
- 4249 N Central Park Ave
- 4619 N Lawndale Ave Unit 1
- 4621 N Monticello Ave
- 4534 N Saint Louis Ave
- 4207 N Drake Ave
- 4203 N Drake Ave
- 4416 N Harding Ave Unit 3
- 4322 N Kimball Ave
- 4602 N Springfield Ave
- 4614 N Springfield Ave
- 4143 N Drake Ave
- 4624 N Springfield Ave
- 4115 N Ridgeway Ave
- 4415 N Lawndale Ave Unit 44153
- 4415 N Lawndale Ave Unit 44152
- 4415 N Lawndale Ave Unit 4415G
- 4415 N Lawndale Ave Unit G
- 4415 N Lawndale Ave Unit 3
- 4415 N Lawndale Ave Unit 1
- 4427 N Lawndale Ave Unit 2A
- 4419 N Lawndale Ave Unit 1A
- 4423 N Lawndale Ave Unit 2A
- 4427 N Lawndale Ave Unit 1B
- 4425 N Lawndale Ave Unit 1A
- 4419 N Lawndale Ave Unit 3A
- 4427 N Lawndale Ave Unit 44273
- 4419 N Lawndale Ave Unit 44192
- 4423 N Lawndale Ave Unit 44232
- 4419 N Lawndale Ave Unit 44192
- 4425 N Lawndale Ave Unit 44253
- 4423 N Lawndale Ave Unit 44233
- 4423 N Lawndale Ave Unit 44232
- 4425 N Lawndale Ave Unit 44253