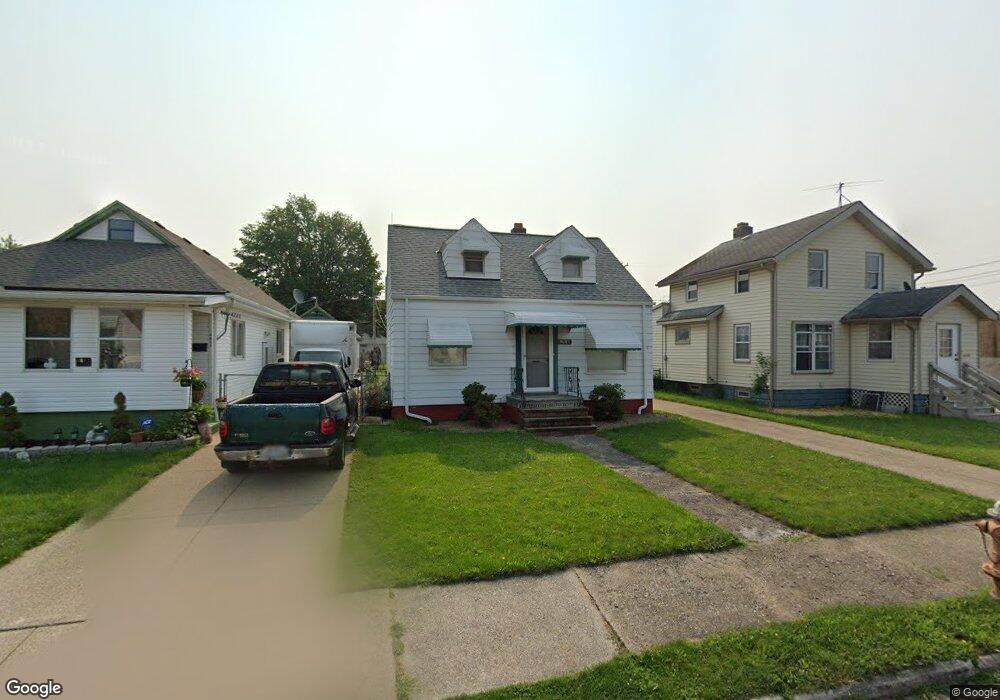
4415 W 139th St Cleveland, OH 44135
Bellaire-Puritas NeighborhoodEstimated Value: $108,000 - $130,000
2
Beds
1
Bath
1,014
Sq Ft
$115/Sq Ft
Est. Value
About This Home
This home is located at 4415 W 139th St, Cleveland, OH 44135 and is currently estimated at $116,941, approximately $115 per square foot. 4415 W 139th St is a home located in Cuyahoga County with nearby schools including Artemus Ward School, Almira Academy, and Benjamin Franklin.
Ownership History
Date
Name
Owned For
Owner Type
Purchase Details
Closed on
Nov 16, 2007
Sold by
Abshire Josephine L
Bought by
Abshire Brian W
Current Estimated Value
Home Financials for this Owner
Home Financials are based on the most recent Mortgage that was taken out on this home.
Original Mortgage
$81,098
Outstanding Balance
$51,497
Interest Rate
6.45%
Mortgage Type
FHA
Estimated Equity
$65,445
Purchase Details
Closed on
Sep 10, 1999
Sold by
Abshire Josephine L and Abshire Jerome Peter
Bought by
Abshire Josephine L
Purchase Details
Closed on
Jul 31, 1992
Sold by
Abshire Josephine L
Bought by
Abshire Josephine L
Purchase Details
Closed on
Jun 30, 1980
Sold by
Obery J Abshire
Bought by
Abshire Josephine L
Purchase Details
Closed on
Apr 2, 1980
Sold by
Abshire Obery J and J L
Bought by
Obery J Abshire
Purchase Details
Closed on
Jan 1, 1975
Bought by
Abshire Obery J and J L
Create a Home Valuation Report for This Property
The Home Valuation Report is an in-depth analysis detailing your home's value as well as a comparison with similar homes in the area
Home Values in the Area
Average Home Value in this Area
Purchase History
| Date | Buyer | Sale Price | Title Company |
|---|---|---|---|
| Abshire Brian W | $82,400 | Firstmerit | |
| Abshire Josephine L | -- | -- | |
| Abshire Josephine L | -- | -- | |
| Abshire Josephine L | -- | -- | |
| Obery J Abshire | -- | -- | |
| Abshire Obery J | -- | -- |
Source: Public Records
Mortgage History
| Date | Status | Borrower | Loan Amount |
|---|---|---|---|
| Open | Abshire Brian W | $81,098 | |
| Closed | Abshire Brian W | $3,296 |
Source: Public Records
Tax History Compared to Growth
Tax History
| Year | Tax Paid | Tax Assessment Tax Assessment Total Assessment is a certain percentage of the fair market value that is determined by local assessors to be the total taxable value of land and additions on the property. | Land | Improvement |
|---|---|---|---|---|
| 2024 | $2,072 | $31,605 | $7,770 | $23,835 |
| 2023 | $1,964 | $25,900 | $5,950 | $19,950 |
| 2022 | $1,953 | $25,900 | $5,950 | $19,950 |
| 2021 | $1,934 | $25,900 | $5,950 | $19,950 |
| 2020 | $1,735 | $20,090 | $4,620 | $15,470 |
| 2019 | $1,604 | $57,400 | $13,200 | $44,200 |
| 2018 | $1,545 | $20,090 | $4,620 | $15,470 |
| 2017 | $1,504 | $18,240 | $3,710 | $14,530 |
| 2016 | $1,492 | $18,240 | $3,710 | $14,530 |
| 2015 | $1,628 | $18,240 | $3,710 | $14,530 |
| 2014 | $1,628 | $19,820 | $4,030 | $15,790 |
Source: Public Records
Map
Nearby Homes
- 4407 W 140th St
- 4322 W 138th St
- 13401 Puritas Ave
- 13410 Gilmore Ave
- 13410 Wainfleet Ave
- 4349 W 132nd St
- 13622 Carrington Ave
- 4497 W 147th St
- 4329 W 131st St
- 13904 Highlandview Ave
- 13514 Bennington Ave
- 13104 Wainfleet Ave
- 13402 Saint James Ave
- 14511 Saint James Ave
- 13313 Highlandview Ave
- 4162 Victory Blvd
- 4484 W 149th St
- 13501 Astor Ave
- 13209 Liberty Ave
- 12701 Milligan Ave
- 4411 W 139th St
- 4419 W 139th St
- 4407 W 139th St
- 4403 W 139th St
- 4399 W 139th St
- 4414 W 139th St
- 4410 W 139th St
- 4418 W 139th St
- 4406 W 139th St
- 4395 W 139th St
- 13904, 13902, 13910 Puritas Ave
- 13904 Puritas Ave
- 13910 Puritas Ave
- 4402 W 139th St
- 13902 Puritas Ave
- 4398 W 139th St
- 13916 Puritas Ave
- W 139th St
- 4390 W 139th St
- 13926 Puritas Ave