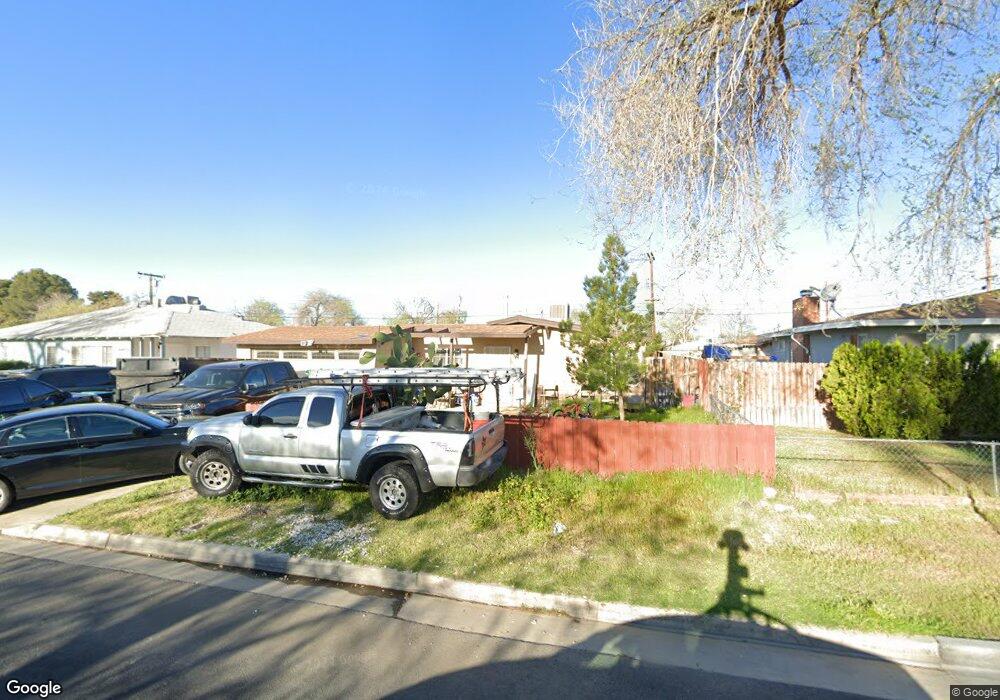
44153 Elm Ave Lancaster, CA 93534
Central Lancaster NeighborhoodEstimated Value: $374,934 - $408,000
4
Beds
2
Baths
1,364
Sq Ft
$285/Sq Ft
Est. Value
About This Home
This home is located at 44153 Elm Ave, Lancaster, CA 93534 and is currently estimated at $389,234, approximately $285 per square foot. 44153 Elm Ave is a home located in Los Angeles County with nearby schools including Sierra Elementary School, Endeavour Middle School, and Antelope Valley High School.
Ownership History
Date
Name
Owned For
Owner Type
Purchase Details
Closed on
Nov 1, 2014
Sold by
Habibi Joseph S
Bought by
The Habibi Family Trust
Current Estimated Value
Purchase Details
Closed on
Jun 26, 2010
Sold by
Federal National Mortgage Association
Bought by
Habibi Joseph Steven
Purchase Details
Closed on
Mar 10, 2010
Sold by
Marron Guillermo
Bought by
Federal National Mortgage Association
Purchase Details
Closed on
May 24, 2005
Sold by
Bradley Phyllis J
Bought by
Marron Guillermo
Home Financials for this Owner
Home Financials are based on the most recent Mortgage that was taken out on this home.
Original Mortgage
$217,800
Interest Rate
4.83%
Mortgage Type
Purchase Money Mortgage
Purchase Details
Closed on
Dec 9, 2000
Sold by
Bradley Phyllis J
Bought by
Bradley Phyllis J and The Phyllis J Bradley Trust
Create a Home Valuation Report for This Property
The Home Valuation Report is an in-depth analysis detailing your home's value as well as a comparison with similar homes in the area
Home Values in the Area
Average Home Value in this Area
Purchase History
| Date | Buyer | Sale Price | Title Company |
|---|---|---|---|
| The Habibi Family Trust | -- | None Available | |
| Habibi Joseph Steven | $71,000 | Lawyers Title | |
| Federal National Mortgage Association | $241,394 | Landsafe Title | |
| Marron Guillermo | $242,000 | Lawyers Title | |
| Bradley Phyllis J | -- | -- |
Source: Public Records
Mortgage History
| Date | Status | Borrower | Loan Amount |
|---|---|---|---|
| Previous Owner | Marron Guillermo | $217,800 |
Source: Public Records
Tax History
| Year | Tax Paid | Tax Assessment Tax Assessment Total Assessment is a certain percentage of the fair market value that is determined by local assessors to be the total taxable value of land and additions on the property. | Land | Improvement |
|---|---|---|---|---|
| 2025 | $2,459 | $91,631 | $18,321 | $73,310 |
| 2024 | $2,459 | $89,835 | $17,962 | $71,873 |
| 2023 | $2,411 | $88,074 | $17,610 | $70,464 |
| 2022 | $2,239 | $86,348 | $17,265 | $69,083 |
| 2021 | $1,866 | $84,656 | $16,927 | $67,729 |
| 2020 | $1,849 | $83,789 | $16,754 | $67,035 |
| 2019 | $1,823 | $82,147 | $16,426 | $65,721 |
| 2018 | $1,793 | $80,537 | $16,104 | $64,433 |
| 2016 | $1,707 | $77,412 | $15,480 | $61,932 |
| 2015 | $1,690 | $76,250 | $15,248 | $61,002 |
| 2014 | $1,701 | $74,758 | $14,950 | $59,808 |
Source: Public Records
Map
Nearby Homes
- 552 W Avenue j4
- 538 W Avenue j4
- 44227 Date Ave
- 521 W Avenue j5
- 44054 Elm Ave
- 44048 Elm Ave
- 44054 Fern Ave
- 4 Gadsden Ave
- 0 Gadsden Ave
- 44108 Gadsden Ave
- 428 W Avenue j5 Unit 21
- 433 W Avenue j5 Unit 13
- 44036 Cedar Ave
- 44309 Hardwood Ave
- 830 W Avenue j4
- 0 Cedar Avenue Vic Ave Unit J
- 6717 6999 Avenue J
- 665 W Avenue J
- 517 W Avenue j10
- 0 Ave J Corner of Genoa Ave Unit 24003618
Your Personal Tour Guide
Ask me questions while you tour the home.