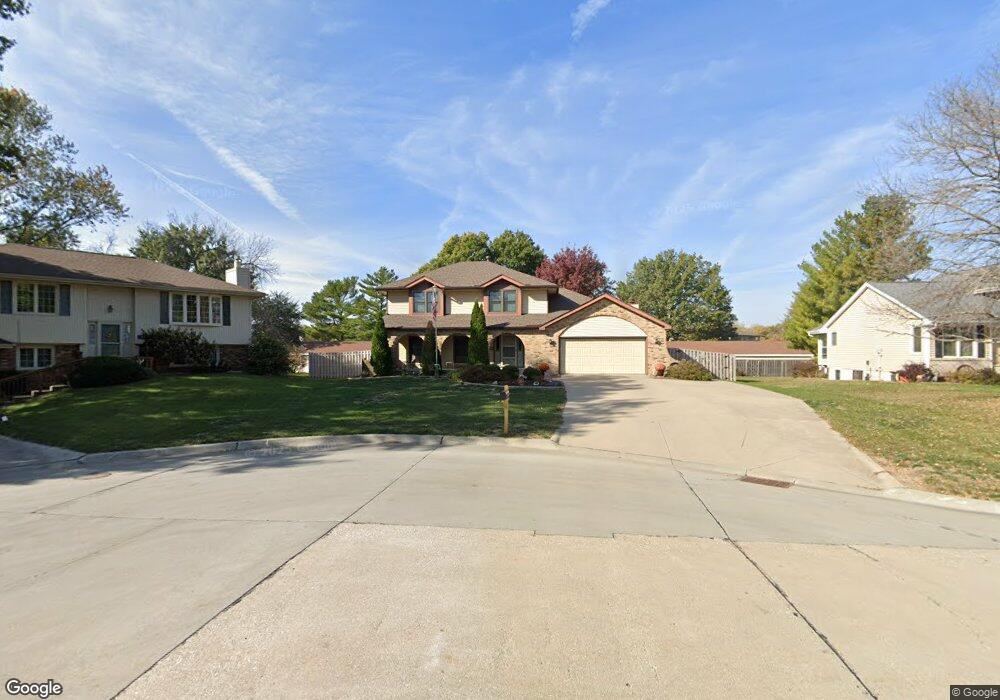
4416 77th St Urbandale, IA 50322
Estimated Value: $352,000 - $363,000
3
Beds
3
Baths
2,002
Sq Ft
$178/Sq Ft
Est. Value
About This Home
This home is located at 4416 77th St, Urbandale, IA 50322 and is currently estimated at $356,362, approximately $178 per square foot. 4416 77th St is a home located in Polk County with nearby schools including Olmsted Elementary School, Urbandale Middle School, and Urbandale High School.
Ownership History
Date
Name
Owned For
Owner Type
Purchase Details
Closed on
Jul 15, 1998
Sold by
Hollen Charles W and Hollen Grace
Bought by
Bair Dennis R and Bair Lisa J
Current Estimated Value
Home Financials for this Owner
Home Financials are based on the most recent Mortgage that was taken out on this home.
Original Mortgage
$116,400
Outstanding Balance
$23,924
Interest Rate
7.05%
Mortgage Type
VA
Estimated Equity
$332,438
Create a Home Valuation Report for This Property
The Home Valuation Report is an in-depth analysis detailing your home's value as well as a comparison with similar homes in the area
Home Values in the Area
Average Home Value in this Area
Purchase History
| Date | Buyer | Sale Price | Title Company |
|---|---|---|---|
| Bair Dennis R | $134,500 | -- |
Source: Public Records
Mortgage History
| Date | Status | Borrower | Loan Amount |
|---|---|---|---|
| Open | Bair Dennis R | $116,400 |
Source: Public Records
Tax History Compared to Growth
Tax History
| Year | Tax Paid | Tax Assessment Tax Assessment Total Assessment is a certain percentage of the fair market value that is determined by local assessors to be the total taxable value of land and additions on the property. | Land | Improvement |
|---|---|---|---|---|
| 2025 | $5,396 | $343,300 | $69,300 | $274,000 |
| 2024 | $5,396 | $324,000 | $64,600 | $259,400 |
| 2023 | $5,078 | $324,000 | $64,600 | $259,400 |
| 2022 | $5,016 | $248,900 | $51,300 | $197,600 |
| 2021 | $5,110 | $248,900 | $51,300 | $197,600 |
| 2020 | $5,220 | $240,600 | $49,500 | $191,100 |
| 2019 | $4,836 | $249,800 | $49,500 | $200,300 |
| 2018 | $4,654 | $222,100 | $43,200 | $178,900 |
| 2017 | $4,338 | $222,100 | $43,200 | $178,900 |
| 2016 | $4,226 | $204,200 | $39,000 | $165,200 |
| 2015 | $4,226 | $204,200 | $39,000 | $165,200 |
| 2014 | $4,008 | $192,700 | $36,300 | $156,400 |
Source: Public Records
Map
Nearby Homes