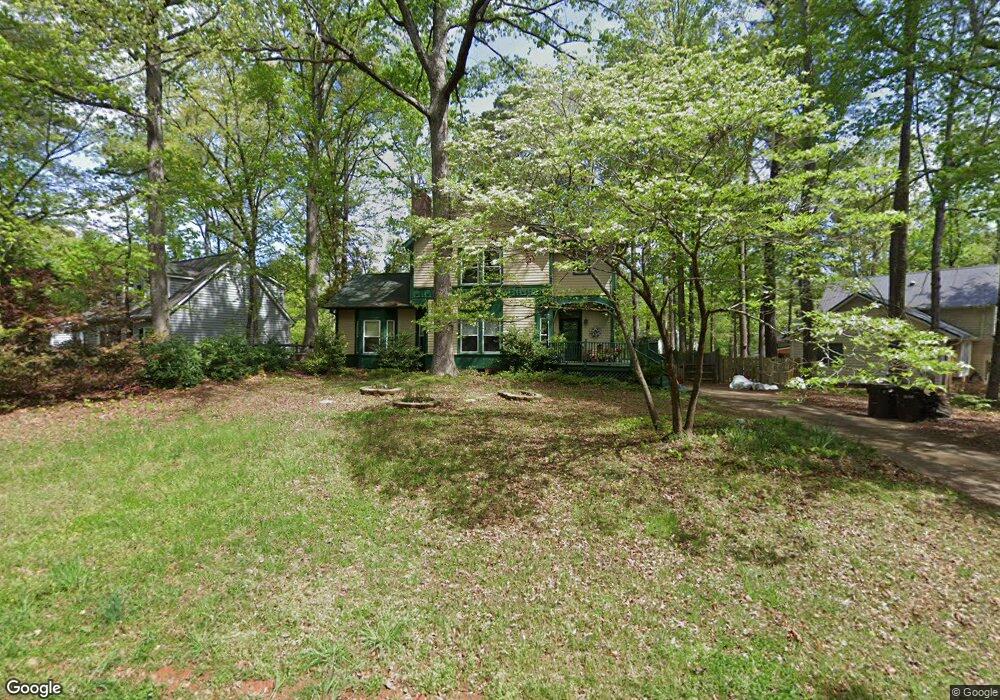
4416 Valley Forge Rd Durham, NC 27705
West Durham NeighborhoodEstimated Value: $505,000 - $596,000
4
Beds
4
Baths
2,170
Sq Ft
$248/Sq Ft
Est. Value
About This Home
This home is located at 4416 Valley Forge Rd, Durham, NC 27705 and is currently estimated at $537,423, approximately $247 per square foot. 4416 Valley Forge Rd is a home located in Durham County with nearby schools including Morehead Montessori, Brogden Middle, and Riverside High School.
Ownership History
Date
Name
Owned For
Owner Type
Purchase Details
Closed on
Jun 24, 2020
Sold by
Fenton Sean and Fenton Judy
Bought by
Henderson Bianca
Current Estimated Value
Home Financials for this Owner
Home Financials are based on the most recent Mortgage that was taken out on this home.
Original Mortgage
$329,800
Outstanding Balance
$292,342
Interest Rate
3.2%
Mortgage Type
New Conventional
Estimated Equity
$245,081
Purchase Details
Closed on
Sep 20, 2000
Sold by
Rios Danielle M and Martini Rios Antonio
Bought by
Fenton Sean and Fenton Judy
Home Financials for this Owner
Home Financials are based on the most recent Mortgage that was taken out on this home.
Original Mortgage
$167,400
Interest Rate
7.92%
Purchase Details
Closed on
Sep 1, 1998
Sold by
Lawrence William B and Lawrence Naomi E
Bought by
Rios Danielle M
Home Financials for this Owner
Home Financials are based on the most recent Mortgage that was taken out on this home.
Original Mortgage
$142,200
Interest Rate
6.99%
Create a Home Valuation Report for This Property
The Home Valuation Report is an in-depth analysis detailing your home's value as well as a comparison with similar homes in the area
Home Values in the Area
Average Home Value in this Area
Purchase History
| Date | Buyer | Sale Price | Title Company |
|---|---|---|---|
| Henderson Bianca | $340,000 | None Available | |
| Fenton Sean | $186,000 | -- | |
| Rios Danielle M | $158,000 | -- |
Source: Public Records
Mortgage History
| Date | Status | Borrower | Loan Amount |
|---|---|---|---|
| Open | Henderson Bianca | $329,800 | |
| Previous Owner | Fenton Sean | $167,400 | |
| Previous Owner | Rios Danielle M | $142,200 |
Source: Public Records
Tax History Compared to Growth
Tax History
| Year | Tax Paid | Tax Assessment Tax Assessment Total Assessment is a certain percentage of the fair market value that is determined by local assessors to be the total taxable value of land and additions on the property. | Land | Improvement |
|---|---|---|---|---|
| 2025 | $5,070 | $511,415 | $130,560 | $380,855 |
| 2024 | $3,669 | $263,026 | $57,735 | $205,291 |
| 2023 | $3,445 | $263,026 | $57,735 | $205,291 |
| 2022 | $3,366 | $263,026 | $57,735 | $205,291 |
| 2021 | $3,351 | $263,026 | $57,735 | $205,291 |
| 2020 | $3,272 | $263,026 | $57,735 | $205,291 |
| 2019 | $3,272 | $263,026 | $57,735 | $205,291 |
| 2018 | $3,143 | $231,727 | $51,320 | $180,407 |
| 2017 | $3,120 | $231,727 | $51,320 | $180,407 |
| 2016 | $3,015 | $231,727 | $51,320 | $180,407 |
| 2015 | $2,663 | $192,378 | $26,299 | $166,079 |
| 2014 | $2,663 | $192,378 | $26,299 | $166,079 |
Source: Public Records
Map
Nearby Homes
- 4316 American Dr
- 310 Mckinley St
- 108 Panamint Dr
- 4002 Westfield Dr
- 24 Sunrise Place
- 123 Forest Oaks Dr
- 4704 Cumberland Dr
- 74 Forest Oaks Dr
- 28 Prestwick Place
- 37 Georgetown Ct
- 82 Forest Oaks Dr
- 210 Silas St
- 13 Providence Ct
- 416 Morreene Rd
- 409 Morreene Rd
- 1013 Coldspring Cir
- Townhome B Exterior Plan at Croasdaile Farm - Bronze Leaf Townhomes
- Custom Plan at Croasdaile Farm - Bronze Leaf Townhomes
- Townhome B Interior Plan at Croasdaile Farm - Bronze Leaf Townhomes
- Townhome A Exterior Plan at Croasdaile Farm - Bronze Leaf Townhomes
- 4412 Valley Forge Rd
- 4420 Valley Forge Rd
- 4 Bunker Hill Place Unit 4B
- 4 Bunker Hill Place Unit 4A
- 4 Bunker Hill Place
- 4406 Valley Forge Rd
- 4417 Valley Forge Rd
- 4419 Valley Forge Rd
- 4415 Valley Forge Rd
- 4413 Valley Forge Rd
- 4400 Valley Forge Rd
- 4423 Valley Forge Rd
- 7 Bunker Hill Place
- 1 Bunker Hill Place
- 4409 Valley Forge Rd
- 4 Kinsey Ct
- 5 Bunker Hill Place
- 15 Tarawa Terrace
- 4405 Valley Forge Rd
- 4501 Valley Forge Rd