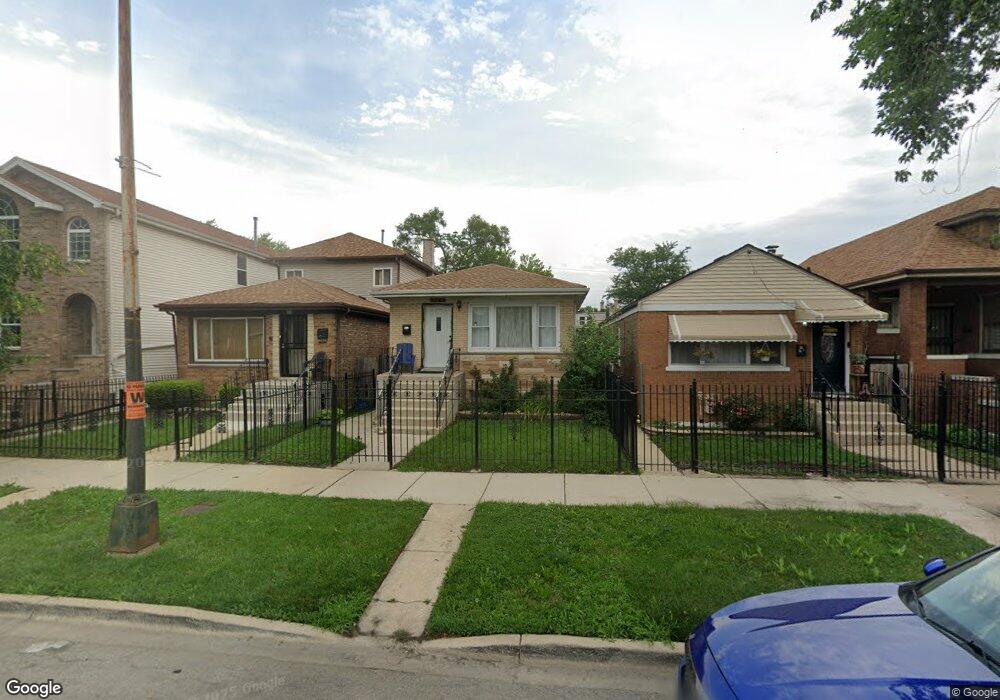
4416 W Augusta Blvd Chicago, IL 60651
West Humboldt Park NeighborhoodEstimated Value: $267,040 - $353,000
3
Beds
1
Bath
969
Sq Ft
$308/Sq Ft
Est. Value
About This Home
This home is located at 4416 W Augusta Blvd, Chicago, IL 60651 and is currently estimated at $298,760, approximately $308 per square foot. 4416 W Augusta Blvd is a home located in Cook County with nearby schools including Brian Piccolo Elementary School, Orr Academy High School, and KIPP One Academy.
Ownership History
Date
Name
Owned For
Owner Type
Purchase Details
Closed on
Aug 19, 2008
Sold by
Gonzalez Julio C and Roman Gonzalez Sol I
Bought by
Figueroa Carlos M and Morales Esperanza
Current Estimated Value
Purchase Details
Closed on
Feb 3, 2003
Sold by
Dejesus Radames and Cruz Allen
Bought by
Gonzalez Julio C and Roman Gonzalez Sol I
Purchase Details
Closed on
Oct 23, 2002
Sold by
S I Boo Llc
Bought by
Dejesus Radames and Cruz Allen
Purchase Details
Closed on
Jun 17, 2002
Sold by
Orr David D
Bought by
S I Boo Llc
Purchase Details
Closed on
Sep 14, 1998
Sold by
Hud
Bought by
Midwest Community Development Corp
Create a Home Valuation Report for This Property
The Home Valuation Report is an in-depth analysis detailing your home's value as well as a comparison with similar homes in the area
Home Values in the Area
Average Home Value in this Area
Purchase History
| Date | Buyer | Sale Price | Title Company |
|---|---|---|---|
| Figueroa Carlos M | $170,000 | Ticor Title Insurance Co | |
| Gonzalez Julio C | $75,000 | -- | |
| Dejesus Radames | -- | Chicago Title Insurance Co | |
| S I Boo Llc | -- | -- | |
| Midwest Community Development Corp | -- | -- |
Source: Public Records
Tax History
| Year | Tax Paid | Tax Assessment Tax Assessment Total Assessment is a certain percentage of the fair market value that is determined by local assessors to be the total taxable value of land and additions on the property. | Land | Improvement |
|---|---|---|---|---|
| 2025 | $4,021 | $20,001 | $4,613 | $15,388 |
| 2024 | $4,021 | $20,001 | $4,613 | $15,388 |
| 2023 | $3,908 | $19,000 | $3,690 | $15,310 |
| 2022 | $3,908 | $19,000 | $3,690 | $15,310 |
| 2021 | $3,821 | $19,000 | $3,690 | $15,310 |
| 2020 | $3,248 | $14,580 | $4,305 | $10,275 |
| 2019 | $3,292 | $16,383 | $4,305 | $12,078 |
| 2018 | $3,236 | $16,383 | $4,305 | $12,078 |
| 2017 | $2,726 | $12,664 | $3,843 | $8,821 |
| 2016 | $2,536 | $12,664 | $3,843 | $8,821 |
| 2015 | $2,321 | $12,664 | $3,843 | $8,821 |
| 2014 | $2,372 | $12,785 | $3,690 | $9,095 |
| 2013 | $2,325 | $12,785 | $3,690 | $9,095 |
Source: Public Records
Map
Nearby Homes
- 5404 W Walton St
- 4241 W Walton St
- 4247 W Haddon Ave
- 4250 W Haddon Ave
- 4222 W Division St
- 920 N Kedvale Ave
- 4319 W Potomac Ave
- 4101 W Iowa St Unit 6
- 919 N Karlov Ave
- 917 N Cicero Ave
- 1406 N Kildare Ave
- 924 N Pulaski Rd
- 831 N Keystone Ave
- 4820 W Haddon Ave
- 4855 W Cortez St
- 4044 W Crystal St
- 4838 W Iowa St
- 1015 N Pulaski Rd
- 4027 W Crystal St Unit 2
- 4355 W Le Moyne St
- 4414 W Augusta Blvd
- 4418 W Augusta Blvd
- 4412 W Augusta Blvd
- 4422 W Augusta Blvd
- 4410 W Augusta Blvd
- 4424 W Augusta Blvd
- 4408 W Augusta Blvd
- 4430 W Augusta Blvd
- 4417 W Cortez St Unit 1F
- 4417 W Cortez St
- 4423 W Cortez St
- 4423 W Cortez St
- 4432 W Augusta Blvd
- 4421 W Cortez St
- 4415 W Cortez St
- 4415 W Cortez St
- 4400 W Augusta Blvd
- 4436 W Augusta Blvd
- 4411 W Cortez St
- 4407 W Cortez St
Your Personal Tour Guide
Ask me questions while you tour the home.