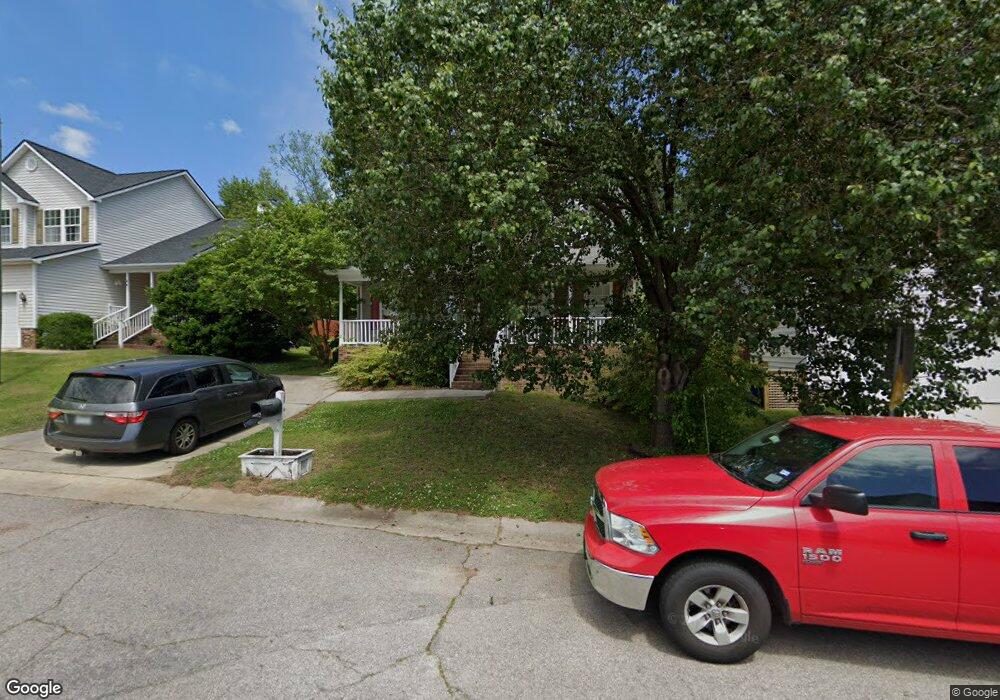
4417 Mardela Spring Dr Raleigh, NC 27616
Estimated Value: $302,000 - $321,000
3
Beds
3
Baths
1,247
Sq Ft
$250/Sq Ft
Est. Value
About This Home
This home is located at 4417 Mardela Spring Dr, Raleigh, NC 27616 and is currently estimated at $311,531, approximately $249 per square foot. 4417 Mardela Spring Dr is a home located in Wake County with nearby schools including River Bend Elementary, River Bend Middle, and Rolesville High School.
Ownership History
Date
Name
Owned For
Owner Type
Purchase Details
Closed on
May 23, 2005
Sold by
Diener James R and Diener Cheryl L
Bought by
Ramos Pablo Humberto and Fernandez Luz M
Current Estimated Value
Home Financials for this Owner
Home Financials are based on the most recent Mortgage that was taken out on this home.
Original Mortgage
$132,156
Outstanding Balance
$68,730
Interest Rate
5.8%
Mortgage Type
FHA
Estimated Equity
$242,801
Purchase Details
Closed on
Aug 28, 2000
Sold by
Bitzenhofer James
Bought by
Diener James R and Diener Cheryl L
Home Financials for this Owner
Home Financials are based on the most recent Mortgage that was taken out on this home.
Original Mortgage
$97,600
Interest Rate
8.24%
Purchase Details
Closed on
Oct 4, 1997
Sold by
South Atlantic Residential Prop Llc
Bought by
Bitzenhofer James
Home Financials for this Owner
Home Financials are based on the most recent Mortgage that was taken out on this home.
Original Mortgage
$106,600
Interest Rate
7.31%
Create a Home Valuation Report for This Property
The Home Valuation Report is an in-depth analysis detailing your home's value as well as a comparison with similar homes in the area
Home Values in the Area
Average Home Value in this Area
Purchase History
| Date | Buyer | Sale Price | Title Company |
|---|---|---|---|
| Ramos Pablo Humberto | $133,500 | -- | |
| Diener James R | $122,000 | -- | |
| Bitzenhofer James | $109,000 | -- |
Source: Public Records
Mortgage History
| Date | Status | Borrower | Loan Amount |
|---|---|---|---|
| Open | Ramos Pablo Humberto | $132,156 | |
| Previous Owner | Diener James R | $97,600 | |
| Previous Owner | Bitzenhofer James | $106,600 |
Source: Public Records
Tax History Compared to Growth
Tax History
| Year | Tax Paid | Tax Assessment Tax Assessment Total Assessment is a certain percentage of the fair market value that is determined by local assessors to be the total taxable value of land and additions on the property. | Land | Improvement |
|---|---|---|---|---|
| 2025 | $2,509 | $285,406 | $90,000 | $195,406 |
| 2024 | $2,499 | $285,406 | $90,000 | $195,406 |
| 2023 | $2,008 | $182,423 | $56,000 | $126,423 |
| 2022 | $1,867 | $182,423 | $56,000 | $126,423 |
| 2021 | $1,795 | $182,423 | $56,000 | $126,423 |
| 2020 | $1,763 | $182,423 | $56,000 | $126,423 |
| 2019 | $1,519 | $129,333 | $33,000 | $96,333 |
| 2018 | $1,433 | $129,333 | $33,000 | $96,333 |
| 2017 | $1,365 | $129,333 | $33,000 | $96,333 |
| 2016 | $1,338 | $129,333 | $33,000 | $96,333 |
| 2015 | $1,452 | $138,279 | $36,000 | $102,279 |
| 2014 | -- | $138,279 | $36,000 | $102,279 |
Source: Public Records
Map
Nearby Homes
- 5604 Leonard Mill Rd
- 5809 Parkchester Rd
- 5708 Sea Fox Ct
- 4422 Cottage Stone Dr
- 4804 Tolley Ct
- 4429 Log Cabin Dr
- 5946 Kohler Ln
- 6016 Four Townes Ln
- 5320 Spring Pines Way
- 4625 Fox Rd
- 4804 Spring Forest Rd
- 4905 Will-O-dean Rd
- 4907 Hollenden Dr Unit 101
- 4907 Hollenden Dr Unit 106
- 3702 San Pablo Dr
- 6305 Musket Ball Ct
- 4804 Red Coat Ct
- 5920 Holly Dr
- 6205 Remington Lake Dr
- 4604 Lavista Ct Unit A & B
- 4413 Mardela Spring Dr
- 4409 Mardela Spring Dr
- 3801 Mardela Spring Dr
- 3800 Mardela Spring Dr
- 4405 Mardela Spring Dr
- 3804 Mardela Spring Dr
- 3805 Mardela Spring Dr
- 5608 Leonard Mill Rd
- 4401 Mardela Spring Dr
- 3808 Mardela Spring Dr
- 5700 Fox Rd
- 4321 Mardela Spring Dr
- 4601 Pat Reed Rd
- 5620 Fox Rd
- 4603 Pat Reed Rd
- 3812 Mardela Spring Dr
- 3813 Mardela Spring Dr
- 4605 Pat Reed Rd
- 4607 Pat Reed Rd
- 5600 Leonard Mill Rd