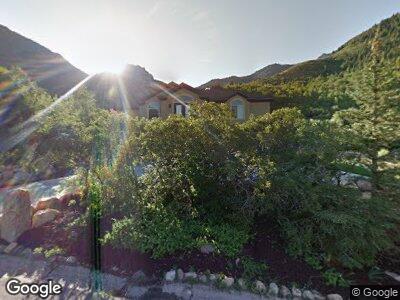
4417 S Zarahemla Dr Salt Lake City, UT 84124
Mount Olympus NeighborhoodEstimated Value: $2,146,347 - $2,464,000
7
Beds
5
Baths
7,321
Sq Ft
$317/Sq Ft
Est. Value
About This Home
This home is located at 4417 S Zarahemla Dr, Salt Lake City, UT 84124 and is currently estimated at $2,322,116, approximately $317 per square foot. 4417 S Zarahemla Dr is a home located in Salt Lake County with nearby schools including Oakridge Elementary School, Churchill Junior High School, and Skyline High School.
Ownership History
Date
Name
Owned For
Owner Type
Purchase Details
Closed on
Feb 17, 2016
Sold by
Turner Craig and Salzman Karen
Bought by
Turner Salzman Family Living Trust and Salzman Karen L
Current Estimated Value
Purchase Details
Closed on
Apr 19, 2012
Sold by
Utah Department Of Transportaion
Bought by
Herriman City
Purchase Details
Closed on
Feb 14, 2011
Sold by
Ivory Homes Ltd
Bought by
Turner Craig and Salzman Karen
Home Financials for this Owner
Home Financials are based on the most recent Mortgage that was taken out on this home.
Original Mortgage
$600,000
Interest Rate
4.84%
Mortgage Type
New Conventional
Purchase Details
Closed on
Jun 9, 2010
Sold by
Rainier Holdings Llc
Bought by
Ivory Homes Ltd
Purchase Details
Closed on
Apr 3, 2007
Sold by
Millington Trent J
Bought by
Zarahemia Llc
Purchase Details
Closed on
Mar 15, 2005
Sold by
Heights Inc
Bought by
Zarahemla Llc
Create a Home Valuation Report for This Property
The Home Valuation Report is an in-depth analysis detailing your home's value as well as a comparison with similar homes in the area
Home Values in the Area
Average Home Value in this Area
Purchase History
| Date | Buyer | Sale Price | Title Company |
|---|---|---|---|
| Turner Salzman Family Living Trust | -- | None Available | |
| Herriman City | -- | None Availables | |
| Turner Craig | -- | Cottonwood Title | |
| Ivory Homes Ltd | -- | Premier Title Ins Agency | |
| Zarahemia Llc | -- | Accommodation | |
| Zarahemla Llc | -- | Meridian Title |
Source: Public Records
Mortgage History
| Date | Status | Borrower | Loan Amount |
|---|---|---|---|
| Previous Owner | Turner Craig | $600,000 |
Source: Public Records
Tax History Compared to Growth
Tax History
| Year | Tax Paid | Tax Assessment Tax Assessment Total Assessment is a certain percentage of the fair market value that is determined by local assessors to be the total taxable value of land and additions on the property. | Land | Improvement |
|---|---|---|---|---|
| 2023 | $10,581 | $1,635,400 | $537,600 | $1,097,800 |
| 2022 | $0 | $1,726,300 | $527,000 | $1,199,300 |
| 2021 | $12,816 | $1,163,400 | $480,900 | $682,500 |
| 2020 | $8,421 | $1,070,600 | $469,600 | $601,000 |
| 2019 | $7,820 | $971,200 | $443,000 | $528,200 |
| 2018 | $0 | $879,800 | $443,000 | $436,800 |
| 2017 | $6,948 | $870,600 | $443,000 | $427,600 |
| 2016 | $6,195 | $783,700 | $443,000 | $340,700 |
| 2015 | $6,939 | $821,700 | $366,500 | $455,200 |
| 2014 | $6,982 | $808,600 | $383,200 | $425,400 |
Source: Public Records
Map
Nearby Homes
- 4345 S Zarahemla Dr
- 4502 S Gilead Way
- 4127 E Mathews Way
- 4228 S 4260 E
- 4279 S Lares Cir
- 4545 S Abinadi Rd
- 4155 S Parkview Dr
- 4471 S Covecrest Dr
- 3885 E Viewcrest Cir
- 4552 S Zarahemla Dr
- 3880 Thousand Oaks Cir
- 3826 E Thousand Oaks Cir
- 3809 E Thousand Oaks Cir
- 3794 Hermes Dr
- 3756 E Hermes Dr
- 4011 Mount Olympus Way
- 4131 S Fortuna Way
- 3794 E Hermes Dr
- 4695 S Thousand Oaks Dr
- 3501 E Loren von Dr
- 4417 S Zarahemla Dr
- 4441 S Zarahemla Dr Unit 57
- 4441 S Zarahemla Dr
- 4403 S Zarahemla Dr
- 4421 S Zarahemla Dr Unit 57
- 4421 S Zarahemla Dr
- 4414 Zarahemla Dr
- 4430 Zarahemla Dr
- 4392 Zarahemla Dr
- 4392 S Zarahemla Dr
- 4383 Zarahemla Dr
- 4444 S Hagoth Cir
- 4231 Helaman Cir
- 4453 S Hagoth Cir
- 4227 Cumorah Dr
- 4452 S Hagoth Cir
- 4457 Gilead Way
- 4374 Zarahemla Dr
- 4374 S Zarahemla Dr
- 4225 Helaman Cir