4417 W 143rd St Cleveland, OH 44135
Jefferson NeighborhoodEstimated Value: $135,689 - $175,000
3
Beds
1
Bath
1,189
Sq Ft
$126/Sq Ft
Est. Value
About This Home
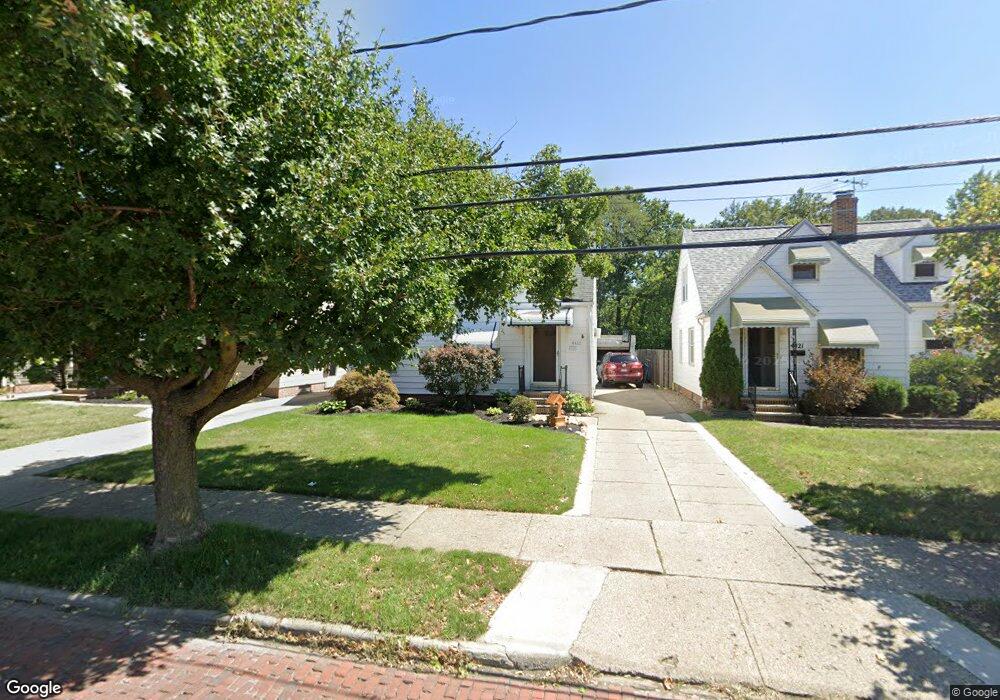
This home is located at 4417 W 143rd St, Cleveland, OH 44135 and is currently estimated at $150,172, approximately $126 per square foot. 4417 W 143rd St is a home located in Cuyahoga County with nearby schools including Artemus Ward School, Almira Academy, and Benjamin Franklin.
Ownership History
Date
Name
Owned For
Owner Type
Purchase Details
Closed on
Jul 27, 1999
Sold by
Worthington Elizabeth F and Shropshire Lon M
Bought by
Truax Stephen J
Current Estimated Value
Home Financials for this Owner
Home Financials are based on the most recent Mortgage that was taken out on this home.
Original Mortgage
$93,200
Outstanding Balance
$26,866
Interest Rate
7.69%
Mortgage Type
FHA
Estimated Equity
$123,306
Purchase Details
Closed on
Jun 3, 1996
Sold by
Cusick Mary Jane
Bought by
Shropshire Elizabeth F Worthington
Home Financials for this Owner
Home Financials are based on the most recent Mortgage that was taken out on this home.
Original Mortgage
$64,928
Interest Rate
7.99%
Mortgage Type
FHA
Purchase Details
Closed on
Feb 14, 1983
Sold by
Cusick John A
Bought by
Mary Jane Cusick
Purchase Details
Closed on
Jan 25, 1978
Sold by
Cusick John and Cusick Mary
Bought by
Cusick John A
Purchase Details
Closed on
Jan 1, 1975
Bought by
Cusick John and Cusick Mary
Create a Home Valuation Report for This Property
The Home Valuation Report is an in-depth analysis detailing your home's value as well as a comparison with similar homes in the area
Home Values in the Area
Average Home Value in this Area
Purchase History
| Date | Buyer | Sale Price | Title Company |
|---|---|---|---|
| Truax Stephen J | $94,000 | -- | |
| Shropshire Elizabeth F Worthington | $65,000 | -- | |
| Mary Jane Cusick | -- | -- | |
| Cusick John A | -- | -- | |
| Cusick John | -- | -- |
Source: Public Records
Mortgage History
| Date | Status | Borrower | Loan Amount |
|---|---|---|---|
| Open | Truax Stephen J | $93,200 | |
| Previous Owner | Shropshire Elizabeth F Worthington | $64,928 |
Source: Public Records
Tax History Compared to Growth
Tax History
| Year | Tax Paid | Tax Assessment Tax Assessment Total Assessment is a certain percentage of the fair market value that is determined by local assessors to be the total taxable value of land and additions on the property. | Land | Improvement |
|---|---|---|---|---|
| 2024 | $2,540 | $38,745 | $9,240 | $29,505 |
| 2023 | $2,387 | $31,470 | $7,040 | $24,430 |
| 2022 | $2,373 | $31,465 | $7,035 | $24,430 |
| 2021 | $2,349 | $31,470 | $7,040 | $24,430 |
| 2020 | $2,107 | $24,400 | $5,460 | $18,940 |
| 2019 | $1,948 | $69,700 | $15,600 | $54,100 |
| 2018 | $2,019 | $24,400 | $5,460 | $18,940 |
| 2017 | $2,113 | $25,630 | $4,380 | $21,250 |
| 2016 | $2,097 | $25,630 | $4,380 | $21,250 |
| 2015 | $2,288 | $25,630 | $4,380 | $21,250 |
| 2014 | $2,288 | $27,860 | $4,760 | $23,100 |
Source: Public Records
Map
Nearby Homes
- 4407 W 140th St
- 4322 W 138th St
- 4497 W 147th St
- 14511 Saint James Ave
- 4484 W 149th St
- 13904 Highlandview Ave
- 13401 Puritas Ave
- 13410 Gilmore Ave
- 4162 Victory Blvd
- 13410 Wainfleet Ave
- 14434 Cleminshaw Rd
- 13622 Carrington Ave
- 4349 W 132nd St
- 14212 Leroy Ave
- 14513 Mission Rd
- 13402 Saint James Ave
- 4046 W 143rd St
- 4688 W 148th St
- 13313 Highlandview Ave
- 4329 W 131st St
- 4421 W 143rd St
- 4413 W 143rd St
- 4425 W 143rd St
- 4409 W 143rd St
- 4405 W 143rd St
- 4429 W 143rd St
- 4401 W 143rd St
- 4431 W 143rd St
- 4387 W 143rd St
- 14226 Puritas Ave
- 4414 W 143rd St
- 4410 W 143rd St
- 4410 W 143rd St Unit 2
- 4418 W 143rd St
- 14236 Puritas Ave
- 14240 Puritas Ave
- 14242 Puritas Ave
- 4404 W 143rd St
- 4379 W 143rd St
- 4422 W 143rd St