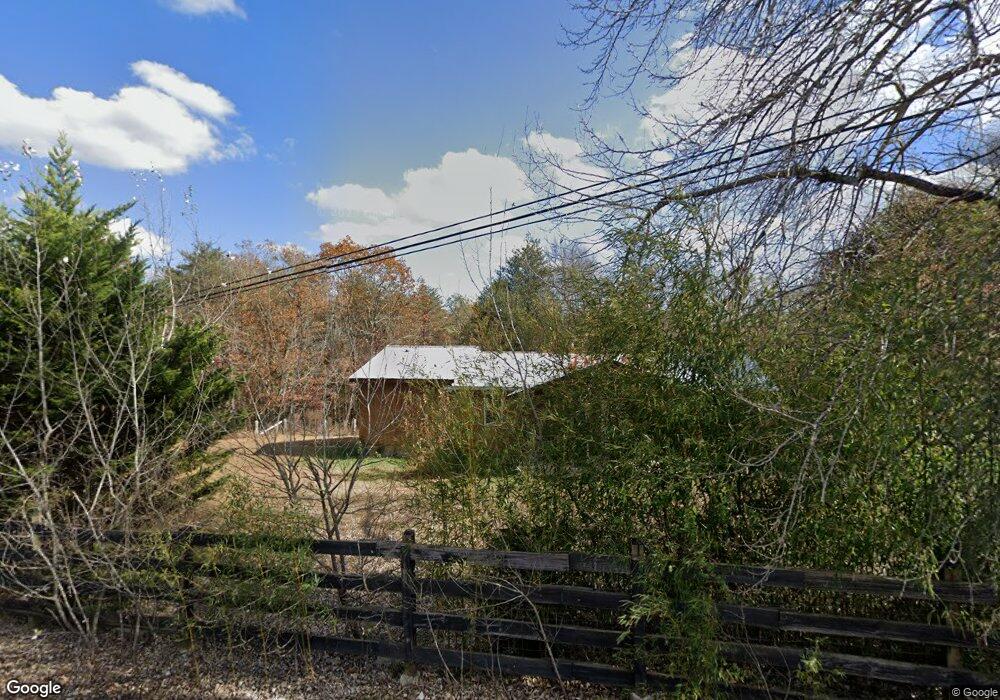
4418 Henson Gap Rd Dunlap, TN 37327
Estimated Value: $135,597 - $411,000
--
Bed
--
Bath
888
Sq Ft
$261/Sq Ft
Est. Value
About This Home
This home is located at 4418 Henson Gap Rd, Dunlap, TN 37327 and is currently estimated at $231,649, approximately $260 per square foot. 4418 Henson Gap Rd is a home located in Sequatchie County with nearby schools including Griffith Elementary School, Sequatchie County Middle School, and Sequatchie County High School.
Ownership History
Date
Name
Owned For
Owner Type
Purchase Details
Closed on
May 12, 2021
Sold by
Lewan Joshua and Kulesa Breeanna
Bought by
Lewan Joshua J and Lewan Breeanna
Current Estimated Value
Purchase Details
Closed on
Apr 29, 2015
Sold by
Adams Ronald Lee
Bought by
Lewan Kathleen M and Lewan Joshua J
Purchase Details
Closed on
Apr 21, 2005
Sold by
Benton Richard D
Bought by
Lee Adams Ronald
Purchase Details
Closed on
Sep 29, 2004
Bought by
Benton Richard D & Wife Pevehouse Steve/ Prec
Purchase Details
Closed on
Jul 2, 2004
Bought by
Wachovia Bank Na
Purchase Details
Closed on
Mar 17, 1999
Sold by
Paulette Baker
Bought by
Dewayne Hughes and Dewayne Tammy
Purchase Details
Closed on
Mar 10, 1999
Sold by
Paulette Baker
Bought by
Paulette Baker
Purchase Details
Closed on
Feb 25, 1999
Bought by
Hughes Dewayne and Wife Tammy
Create a Home Valuation Report for This Property
The Home Valuation Report is an in-depth analysis detailing your home's value as well as a comparison with similar homes in the area
Home Values in the Area
Average Home Value in this Area
Purchase History
| Date | Buyer | Sale Price | Title Company |
|---|---|---|---|
| Lewan Joshua J | -- | None Available | |
| Lewan Joshua J | -- | None Available | |
| Lewan Kathleen M | $39,000 | -- | |
| Lee Adams Ronald | $36,000 | -- | |
| Benton Richard D & Wife Pevehouse Steve/ Prec | $24,000 | -- | |
| Wachovia Bank Na | $30,600 | -- | |
| Dewayne Hughes | $25,500 | -- | |
| Paulette Baker | $15,000 | -- | |
| Hughes Dewayne | $25,000 | -- |
Source: Public Records
Tax History Compared to Growth
Tax History
| Year | Tax Paid | Tax Assessment Tax Assessment Total Assessment is a certain percentage of the fair market value that is determined by local assessors to be the total taxable value of land and additions on the property. | Land | Improvement |
|---|---|---|---|---|
| 2024 | $342 | $18,600 | $5,775 | $12,825 |
| 2023 | $342 | $18,600 | $5,775 | $12,825 |
| 2022 | $264 | $10,825 | $4,550 | $6,275 |
| 2021 | $264 | $10,825 | $4,550 | $6,275 |
| 2020 | $264 | $10,825 | $4,550 | $6,275 |
| 2019 | $264 | $10,825 | $4,550 | $6,275 |
| 2018 | $264 | $10,825 | $4,550 | $6,275 |
| 2017 | $264 | $10,825 | $4,550 | $6,275 |
| 2016 | $288 | $11,225 | $5,250 | $5,975 |
| 2015 | $288 | $11,225 | $5,250 | $5,975 |
| 2014 | -- | $10,025 | $4,650 | $5,375 |
Source: Public Records
Map
Nearby Homes
- 0 Henson Gap Rd Unit 1399012
- 0 Sawmill Creek Rd
- 0 Window Rock Rd Unit 1521316
- 2700 Snyder Loop
- 2724 Snyder Loop
- 5492 Henson Gap Rd
- 1004 Window Rock Rd
- 0 Lewis Chapel Rd Unit RTC2798030
- 0 Lewis Chapel Rd Unit 1508334
- 174 Buck Run Estates Rd
- 406 Green Brier Ln
- 4 Henson Gap Rd
- 1901 Lewis Chapel Rd
- 533 Gun Shop Rd
- 101 Snow Bird Ln
- 113 Raven Cliff Rd
- 0 E Valley Rd Unit 1507623
- 0 E Valley Rd Unit 1507621
- 0 E Valley Rd Unit 1507625
- 0 E Valley Rd Unit RTC2821090
- 4286 Henson Gap Rd
- 0 Poe Rd Unit 1130956
- 0 Poe Rd Unit 152196
- 0 Poe Rd Unit 158629
- 1 Poe Rd
- 0 Poe Rd Unit 1033933
- 0 Poe Rd Unit 1038098
- 0 Poe Rd Unit 1035885
- 0 Poe Rd Unit 673934
- 0 Poe Rd Unit 1039499
- 0 Poe Rd Unit 1008805
- 0 Poe Rd Unit 1059469
- 0 Poe Rd Unit 1046446
- 0 Poe Rd Unit 1037876
- 0 Poe Rd Unit 1019587
- 0 Poe Rd Unit 1003856
- 222 Pasco Cemetery Rd
- 36 Pasco Cemetery Rd
- 4296 Henson Gap Rd
- 201 Pasco Cemetery Rd