4419 9th Ave E Bradenton, FL 34208
East Bradenton NeighborhoodEstimated Value: $345,799 - $404,000
About This Home
Please note, our homes are available on a first-come, first-serve basis and are not reserved until the lease is signed by all applicants and security deposits are collected.
This home features Progress Smart Home - Progress Residential's smart home app, which allows you to control the home securely from any of your devices. Learn more at
Apply to lease this home by October 31, 2024 and receive $1500 off your first full month’s rent.
Want to tour on your own? Click the “Self Tour” button on this home’s listing or call to register for a self-guided showing at a time that works best for you.
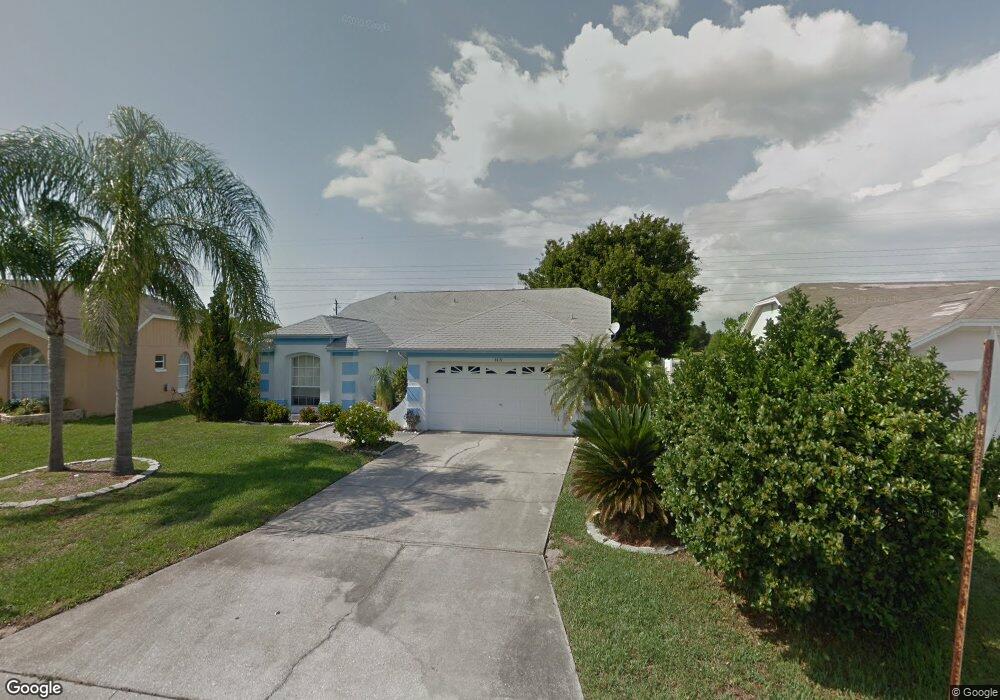
This Bradenton rental home welcomes you with a nicely landscaped front yard and a cheerful stucco exterior with attractive windows. The rambler includes three bedrooms and two bathrooms. When you step into the living room, you'll see stunning light-colored flooring, a high ceiling, and a sliding glass door that leads to the backyard. A large pantry will draw your attention in the kitchen, as will stainless-steel appliances, white cabinets, and a stylish white subway tile backsplash. As you tour the master bedroom, you'll be sure to notice its vaulted ceiling, light-colored floor, and neutral walls, features that make customizing a breeze. This house comes with a fenced yard and an enclosed back porch. Call for a tour today.
Ownership History
Purchase Details
Purchase Details
Purchase Details
Purchase Details
Home Financials for this Owner
Home Financials are based on the most recent Mortgage that was taken out on this home.Home Values in the Area
Average Home Value in this Area
Purchase History
| Date | Buyer | Sale Price | Title Company |
|---|---|---|---|
| True North Property Owner B Llc | -- | Select Title | |
| Wilmington Savings Fund Society Fsb | $37,100 | None Available | |
| Malone Steven | $2,000 | Attorney | |
| Malone Kim E | $271,500 | Masters Title Services Of Ma |
Mortgage History
| Date | Status | Borrower | Loan Amount |
|---|---|---|---|
| Previous Owner | Malone Kim E | $137,500 |
Property History
| Date | Event | Price | List to Sale | Price per Sq Ft |
|---|---|---|---|---|
| 10/27/2024 10/27/24 | Off Market | $2,460 | -- | -- |
| 10/22/2024 10/22/24 | For Rent | $2,460 | 0.0% | -- |
| 10/22/2024 10/22/24 | Off Market | $2,460 | -- | -- |
| 10/21/2024 10/21/24 | Price Changed | $2,460 | -2.6% | $2 / Sq Ft |
| 10/17/2024 10/17/24 | Price Changed | $2,525 | -1.9% | $2 / Sq Ft |
| 10/15/2024 10/15/24 | Price Changed | $2,575 | -0.2% | $2 / Sq Ft |
| 10/14/2024 10/14/24 | Price Changed | $2,580 | +0.2% | $2 / Sq Ft |
| 10/13/2024 10/13/24 | Price Changed | $2,575 | -0.8% | $2 / Sq Ft |
| 10/11/2024 10/11/24 | Price Changed | $2,595 | -7.3% | $2 / Sq Ft |
| 10/04/2024 10/04/24 | Price Changed | $2,800 | -2.3% | $2 / Sq Ft |
| 10/02/2024 10/02/24 | Price Changed | $2,865 | +0.4% | $2 / Sq Ft |
| 09/30/2024 09/30/24 | Price Changed | $2,855 | -1.6% | $2 / Sq Ft |
| 09/28/2024 09/28/24 | Price Changed | $2,900 | -0.3% | $2 / Sq Ft |
| 09/27/2024 09/27/24 | Price Changed | $2,910 | -0.2% | $2 / Sq Ft |
| 09/26/2024 09/26/24 | Price Changed | $2,915 | -0.3% | $2 / Sq Ft |
| 09/25/2024 09/25/24 | Price Changed | $2,925 | -0.5% | $2 / Sq Ft |
| 09/24/2024 09/24/24 | Price Changed | $2,940 | -0.2% | $2 / Sq Ft |
| 09/23/2024 09/23/24 | Price Changed | $2,945 | -3.6% | $2 / Sq Ft |
| 09/21/2024 09/21/24 | Price Changed | $3,055 | -0.3% | $2 / Sq Ft |
| 09/17/2024 09/17/24 | Price Changed | $3,065 | -1.1% | $2 / Sq Ft |
| 09/17/2024 09/17/24 | Price Changed | $3,100 | +0.3% | $2 / Sq Ft |
| 09/17/2024 09/17/24 | For Rent | $3,090 | -- | -- |
Tax History
| Year | Tax Paid | Tax Assessment Tax Assessment Total Assessment is a certain percentage of the fair market value that is determined by local assessors to be the total taxable value of land and additions on the property. | Land | Improvement |
|---|---|---|---|---|
| 2025 | $6,497 | $320,353 | $68,000 | $252,353 |
| 2024 | $6,497 | $351,729 | $68,000 | $283,729 |
| 2023 | $6,379 | $338,068 | $51,000 | $287,068 |
| 2022 | $5,171 | $292,339 | $45,000 | $247,339 |
| 2021 | $4,467 | $236,806 | $45,000 | $191,806 |
| 2020 | $1,648 | $124,543 | $0 | $0 |
| 2019 | $1,609 | $121,743 | $0 | $0 |
| 2018 | $1,584 | $119,473 | $0 | $0 |
| 2017 | $1,467 | $117,016 | $0 | $0 |
| 2016 | $1,449 | $114,609 | $0 | $0 |
| 2015 | $1,457 | $113,812 | $0 | $0 |
| 2014 | $1,457 | $112,909 | $0 | $0 |
| 2013 | $1,442 | $111,240 | $18,350 | $92,890 |
Map
- 1003 45th St E
- 4203 14th Ave E
- 709 47th St E
- 4841 9th Ave E
- 4532 Fern Dr
- 4416 Spicewood Dr Unit J
- 4416 Spicewood Dr Unit K
- 4412 Spicewood Dr Unit E
- 1204 50th St E
- 3995 Lakewood Ave
- 1221 50th Street Ct E
- 1002 Pussywillow Ln
- 4003 Joyce Dr
- 806 Hickory Ln
- 4612 4th Ave E
- 3906 Chinaberry Rd
- 3904 Chinaberry Rd
- 5312 Tide Point Way
- 4603 4th Ave E
- 3807 Chinaberry Rd
- 4419 9th Ave E Unit 1
- 4417 9th Ave E
- 4421 9th Ave E
- 4501 9th Ave E
- 4411 9th Ave E
- 902 45th St E
- 4503 9th Ave E
- 902 44th St E
- 905 44th St E
- 4502 9th Ave E
- 904 45th St E
- 4505 9th Ave E
- 904 44th St E
- 906 45th St E
- 1613 S Elmwood Dr
- 907 44th St E
- 4504 9th Ave E
- 720 45th St E
- 4502 8th Ave E
- 905 45th St E
Ask me questions while you tour the home.