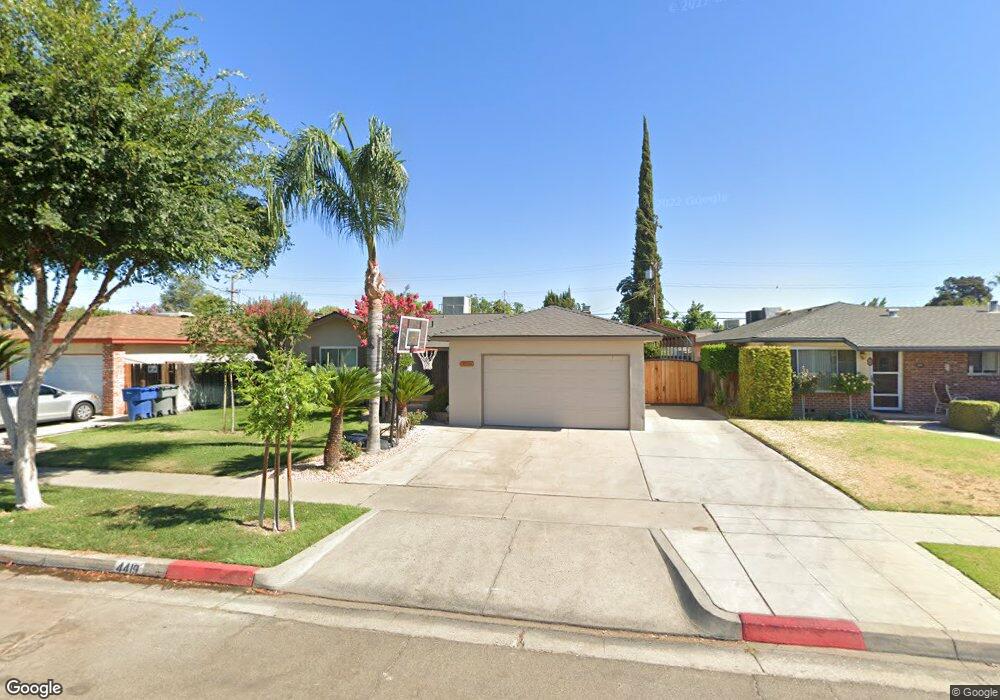
4419 E Austin Way Fresno, CA 93726
Hoover NeighborhoodEstimated Value: $320,000 - $344,000
3
Beds
2
Baths
1,202
Sq Ft
$276/Sq Ft
Est. Value
About This Home
This home is located at 4419 E Austin Way, Fresno, CA 93726 and is currently estimated at $331,262, approximately $275 per square foot. 4419 E Austin Way is a home located in Fresno County with nearby schools including Vinland Elementary School, Tioga Middle School, and Herbert Hoover High School.
Ownership History
Date
Name
Owned For
Owner Type
Purchase Details
Closed on
Sep 28, 2003
Sold by
Sees Nate
Bought by
Contreras Santiago and Contreras Sofia
Current Estimated Value
Home Financials for this Owner
Home Financials are based on the most recent Mortgage that was taken out on this home.
Original Mortgage
$149,950
Outstanding Balance
$69,639
Interest Rate
6.14%
Mortgage Type
Purchase Money Mortgage
Estimated Equity
$261,623
Purchase Details
Closed on
Oct 4, 2002
Sold by
Pittenger Jeff B and Pittenger Julie C
Bought by
Sees Nate
Home Financials for this Owner
Home Financials are based on the most recent Mortgage that was taken out on this home.
Original Mortgage
$112,900
Interest Rate
5.99%
Purchase Details
Closed on
Dec 27, 1999
Sold by
Scott Hern and Nicole Gibbs
Bought by
Pittenger Jeff B
Home Financials for this Owner
Home Financials are based on the most recent Mortgage that was taken out on this home.
Original Mortgage
$75,883
Interest Rate
7.84%
Mortgage Type
FHA
Create a Home Valuation Report for This Property
The Home Valuation Report is an in-depth analysis detailing your home's value as well as a comparison with similar homes in the area
Home Values in the Area
Average Home Value in this Area
Purchase History
| Date | Buyer | Sale Price | Title Company |
|---|---|---|---|
| Contreras Santiago | $150,000 | Financial Title Company | |
| Sees Nate | $119,000 | Fidelity National Title Co | |
| Pittenger Jeff B | $76,000 | Stewart Title |
Source: Public Records
Mortgage History
| Date | Status | Borrower | Loan Amount |
|---|---|---|---|
| Open | Contreras Santiago | $149,950 | |
| Previous Owner | Sees Nate | $112,900 | |
| Previous Owner | Pittenger Jeff B | $75,883 | |
| Closed | Pittenger Jeff B | $4,560 |
Source: Public Records
Tax History Compared to Growth
Tax History
| Year | Tax Paid | Tax Assessment Tax Assessment Total Assessment is a certain percentage of the fair market value that is determined by local assessors to be the total taxable value of land and additions on the property. | Land | Improvement |
|---|---|---|---|---|
| 2025 | $2,667 | $212,539 | $31,268 | $181,271 |
| 2023 | $2,617 | $204,287 | $30,054 | $174,233 |
| 2022 | $2,581 | $200,282 | $29,465 | $170,817 |
| 2021 | $2,511 | $196,356 | $28,888 | $167,468 |
| 2020 | $2,500 | $194,343 | $28,592 | $165,751 |
| 2019 | $2,404 | $190,533 | $28,032 | $162,501 |
| 2018 | $2,352 | $186,798 | $27,483 | $159,315 |
| 2017 | $2,211 | $175,000 | $45,000 | $130,000 |
| 2016 | $1,934 | $155,000 | $45,000 | $110,000 |
| 2015 | $1,694 | $135,500 | $19,800 | $115,700 |
| 2014 | $1,591 | $127,000 | $18,600 | $108,400 |
Source: Public Records
Map
Nearby Homes
- 4404 E Buckingham Way
- 4022 E Ashlan Ave
- 4466 E Donner Ave
- 4446 N Meridian Ave
- 3920 E Norwich Ave
- 4561 E Norwich Ave
- 3816 E Donner Ave
- 3885 E Gettysburg Ave
- 3919 E Pico Ave
- 4627 N Maple Ave
- 4002 E Dakota Ave Unit 104
- 3625 E Bellaire Way
- 4779 N Cedar Ave Unit 109
- 4765 N Cedar Ave Unit 102
- 4765 N Cedar Ave Unit 105
- 4755 N Cedar Ave Unit 104
- 3890 E Santa Ana Ave
- 4617 E Garland Ave
- 4724 E Donner Ave
- 4745 E Ashcroft Ave
- 4427 E Austin Way
- 4411 E Austin Way
- 4420 E Swift Ave
- 4428 E Swift Ave
- 4412 E Swift Ave
- 4345 E Austin Way
- 4435 E Austin Way
- 4436 E Swift Ave
- 4346 E Swift Ave
- 4418 E Austin Way
- 4337 E Austin Way
- 4426 E Austin Way
- 4410 E Austin Way
- 4443 E Austin Way
- 4444 E Swift Ave
- 4338 E Swift Ave
- 4344 E Austin Way
- 4434 E Austin Way
- 4329 E Austin Way
- 4451 E Austin Way