
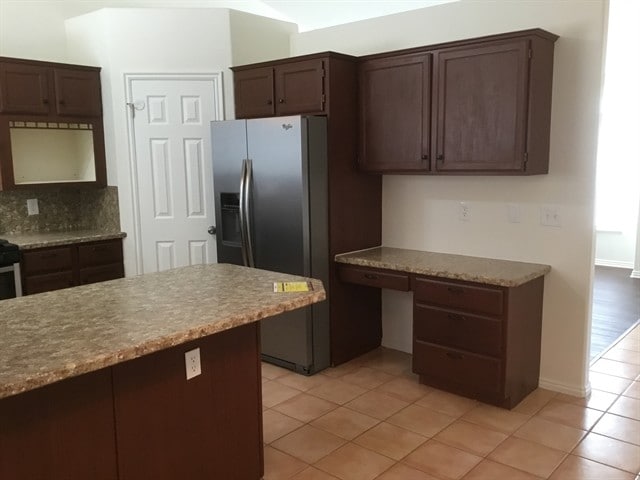
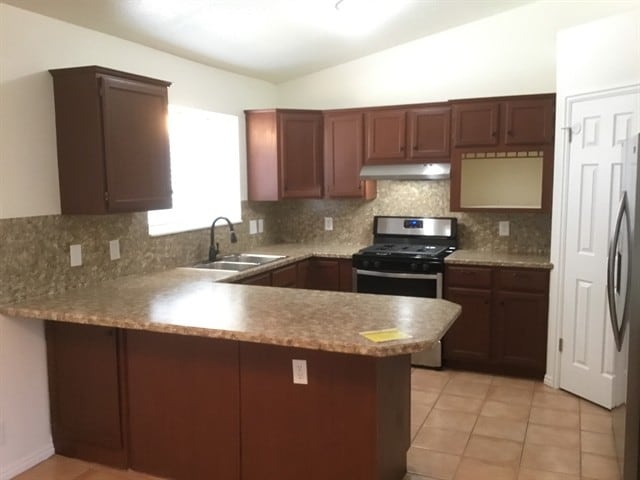
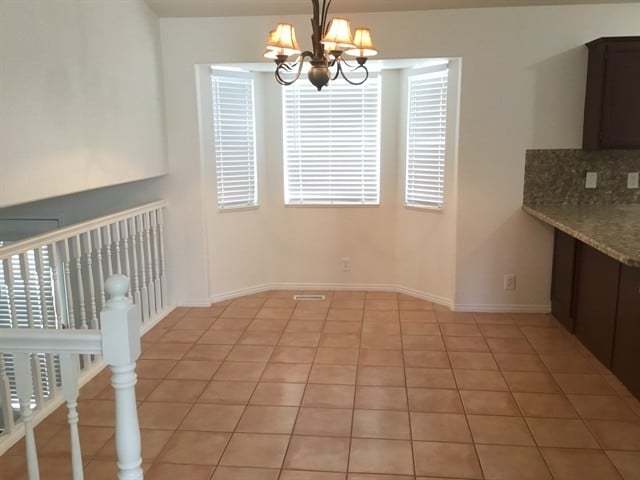
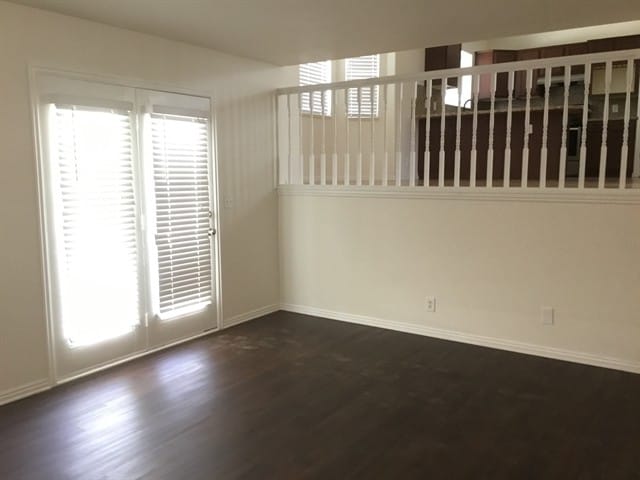
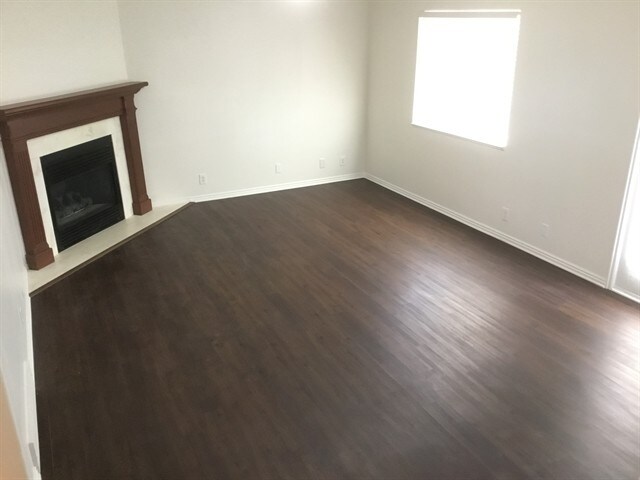
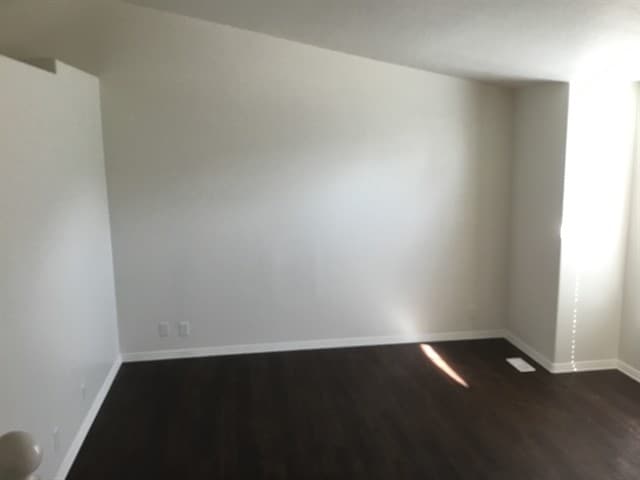
About This Home
Special offer: Pay just 50% of your base rent (taxes and fees not included) as your security deposit, valid for new applicants who sign a 12-month lease by December 31, 2025. Offer is contingent on application approval and execution of a lease agreement. Other terms and conditions may apply. This property is professionally managed by American Homes 4 Rent, a leading single-family rental company. We expect to make this property available for showings soon. We work to simplify your rental experience by offering self-guided tours and a streamlined leasing process you can complete all online, all on your own schedule. Once moved in, we provide maintenance support that you can rely on, so you can enjoy your weekends stress-free. We look forward to welcoming you home! Utilities, taxes, and other fees may apply. Please verify and confirm all information before signing a lease. If you have questions, don’t hesitate to contact us at the telephone number on this property listing. All lease applications, documentation, and initial payments for this property, must be submitted directly through or by phone. The photos, renderings, or other images of the properties on our website, are for illustrative purposes only, and may vary from the features, amenities, or phase of construction. We do not advertise properties on Craigslist, Facebook Marketplace, or other classified advertising websites. If you believe one of our residences is listed there, please notify us. For further description of applicable fees, please go to our website.

Map
- 2816 W 4400 S
- 2802 W 4375 S
- 2642 W 4400 S
- 2835 W 4200 S
- 2777 W 4175 S Unit 229
- 2979 W 4275 S
- 4635 S 2950 W
- 4118 Westlake Dr
- 1952 W 5450 S
- 3084 W 4375 S
- 4670 S 2525 W
- 2550 W 4750 S
- 3014 W 4750 S
- 2917 W 3970 S Unit 53
- 4875 S 2675 W
- 3963 S 2925 W
- 2263 W 4400 S
- 4891 S 2875 W
- 4440 Stone Creek Rd Unit 2E
- 4919 S 2675 W
- 4389 S Locomotive Dr
- 4621 S W Pk Dr
- 3024 W 4450 S
- 2619 W 4650 S
- 2602 W 4050 S
- 2575 W 4800 S
- 2225 W 4350 S
- 3315 Birch Creek Rd
- 3330 W 4000 S
- 4486 S 3600 W
- 2405 Hinckley Dr
- 4499 S 1930 W
- 5239 S 2700 W
- 1934 W 4700 S Unit 1
- 4536 S 1900 W Unit 12
- 3652 W 4625 S
- 4539 S 1800 W
- 1801 W 4650 S
- 5000 S 1900 W
- 4056 W 4600 S