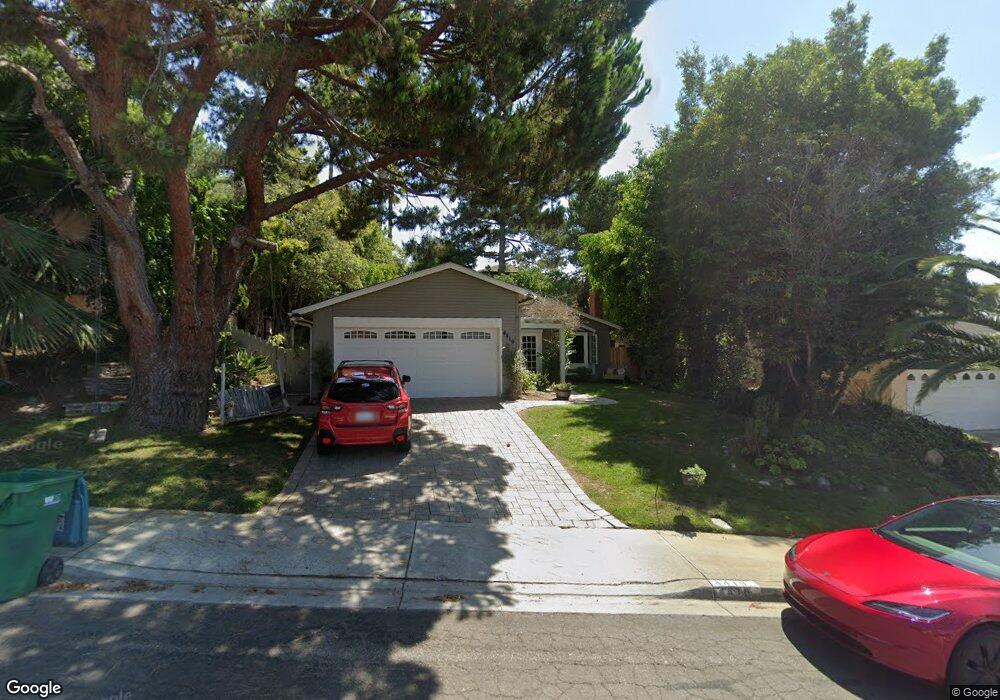
4419 Springtime Dr Oceanside, CA 92056
Peacock NeighborhoodEstimated Value: $689,601 - $906,000
3
Beds
2
Baths
1,060
Sq Ft
$764/Sq Ft
Est. Value
About This Home
This home is located at 4419 Springtime Dr, Oceanside, CA 92056 and is currently estimated at $810,150, approximately $764 per square foot. 4419 Springtime Dr is a home located in San Diego County with nearby schools including T.H.E Leadership Academy, Roosevelt Middle School, and Vista High School.
Ownership History
Date
Name
Owned For
Owner Type
Purchase Details
Closed on
May 8, 2002
Sold by
Reinke Jeffrey D and Reinke Robin M
Bought by
Hernandez Rey and Albright Kristin
Current Estimated Value
Home Financials for this Owner
Home Financials are based on the most recent Mortgage that was taken out on this home.
Original Mortgage
$228,400
Interest Rate
6.83%
Purchase Details
Closed on
Feb 18, 1994
Sold by
Bassett Charles S and Bassett Denise G
Bought by
Reinke Jeffrey D and Reinke Robin M
Home Financials for this Owner
Home Financials are based on the most recent Mortgage that was taken out on this home.
Original Mortgage
$101,200
Interest Rate
7%
Purchase Details
Closed on
Jul 11, 1985
Create a Home Valuation Report for This Property
The Home Valuation Report is an in-depth analysis detailing your home's value as well as a comparison with similar homes in the area
Home Values in the Area
Average Home Value in this Area
Purchase History
| Date | Buyer | Sale Price | Title Company |
|---|---|---|---|
| Hernandez Rey | $285,500 | Chicago Title Co | |
| Reinke Jeffrey D | $126,500 | Continental Lawyers Title | |
| -- | $91,000 | -- |
Source: Public Records
Mortgage History
| Date | Status | Borrower | Loan Amount |
|---|---|---|---|
| Previous Owner | Hernandez Rey | $228,400 | |
| Previous Owner | Reinke Jeffrey D | $101,200 | |
| Closed | Hernandez Rey | $57,100 |
Source: Public Records
Tax History
| Year | Tax Paid | Tax Assessment Tax Assessment Total Assessment is a certain percentage of the fair market value that is determined by local assessors to be the total taxable value of land and additions on the property. | Land | Improvement |
|---|---|---|---|---|
| 2025 | $4,505 | $421,751 | $221,586 | $200,165 |
| 2024 | $4,505 | $413,483 | $217,242 | $196,241 |
| 2023 | $4,396 | $405,377 | $212,983 | $192,394 |
| 2022 | $4,384 | $397,429 | $208,807 | $188,622 |
| 2021 | $4,286 | $389,637 | $204,713 | $184,924 |
| 2020 | $4,270 | $385,642 | $202,614 | $183,028 |
| 2019 | $4,207 | $378,082 | $198,642 | $179,440 |
| 2018 | $4,000 | $370,670 | $194,748 | $175,922 |
| 2017 | $70 | $363,403 | $190,930 | $172,473 |
| 2016 | $6,893 | $356,279 | $187,187 | $169,092 |
| 2015 | $3,816 | $350,929 | $184,376 | $166,553 |
| 2014 | $3,721 | $344,056 | $180,765 | $163,291 |
Source: Public Records
Map
Nearby Homes
- 4445 Sunburst Dr
- 702 Pecan Ct
- 1333 Olive Ave Unit 37
- 1333 Olive Ave Unit 60
- 4216 Esperanza Way
- 4220 Apache St
- 675 Grant Ct
- 683 Grant Ct
- 1723 Wildflower Ct
- 4325 Via Tercero
- 1826 Via Quinto
- 4530 Beverly Glen Dr
- 4535 Golden Ridge Dr
- 4558 Golden Ridge Dr
- 523 Hatherly St
- 4142 Alana Cir
- 4128 Terry St
- 1813 Avenida Segovia
- 1789 Avenida Segovia
- 4129 Terry St
- 4415 Springtime Dr
- 4423 Springtime Dr
- 4411 Springtime Dr
- 4460 Summer Dr
- 4462 Summer Dr
- 4427 Springtime Dr
- 4458 Summer Dr
- 4422 Springtime Dr
- 4426 Springtime Dr
- 4407 Springtime Dr
- 4431 Springtime Dr
- 4418 Springtime Dr
- 4470 Summer Dr
- 4454 Summer Dr
- 4430 Springtime Dr
- 4414 Springtime Dr
- 2401 Winter Rd
- 4403 Springtime Dr
- 4435 Springtime Dr
- 4450 Summer Dr
Your Personal Tour Guide
Ask me questions while you tour the home.