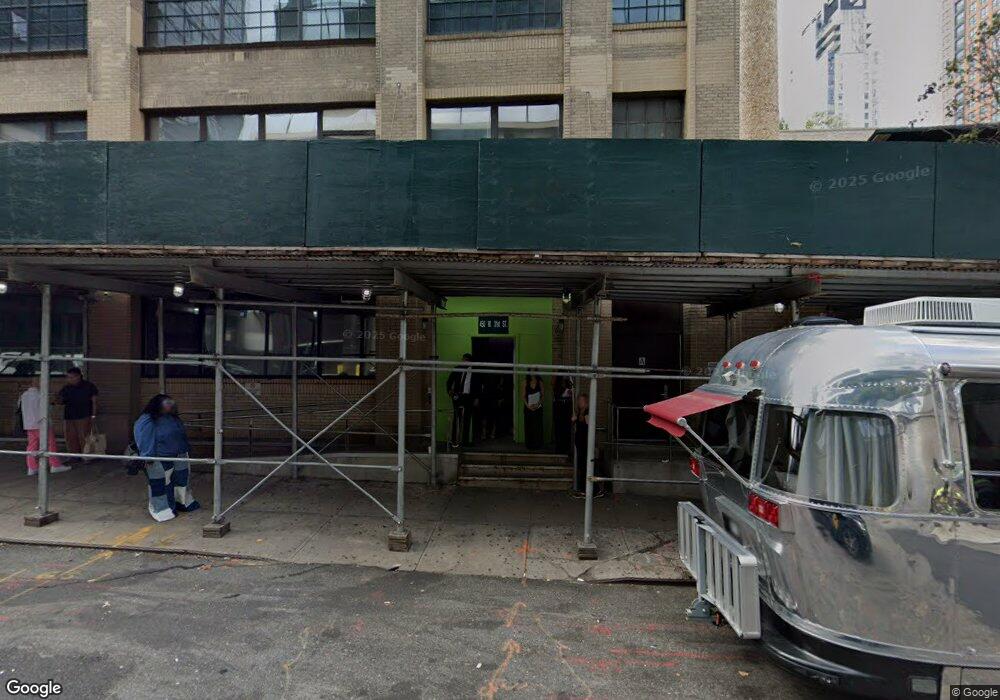
442-454 W 31st St New York, NY 10001
Hudson Yards NeighborhoodEstimated Value: $7,943,807
--
Bed
--
Bath
112,146
Sq Ft
$71/Sq Ft
Est. Value
About This Home
This home is located at 442-454 W 31st St, New York, NY 10001 and is currently priced at $7,943,807, approximately $70 per square foot. 442-454 W 31st St is a home located in New York County with nearby schools including P.S. 33 Chelsea Prep, Clinton School, and Middle School 297.
Ownership History
Date
Name
Owned For
Owner Type
Purchase Details
Closed on
Sep 28, 2022
Sold by
Pumpkinomcpi Llc
Bought by
Venmel 3 Llc
Current Estimated Value
Purchase Details
Closed on
Sep 30, 2021
Sold by
Studio Management Corp
Bought by
Venmel 8 Llc
Purchase Details
Closed on
Sep 5, 2018
Sold by
Brady James and Brady Jane
Bought by
Venmel Llc
Purchase Details
Closed on
Aug 23, 2018
Sold by
Galloway James
Bought by
Jaya Ny Llc
Purchase Details
Closed on
Feb 1, 2018
Sold by
Good Light Studio 2 Llc
Bought by
Ttn Realty Holdings Corp
Purchase Details
Closed on
Jun 7, 2017
Sold by
Aac Realty Llc
Bought by
The One Club For Creativity Inc
Create a Home Valuation Report for This Property
The Home Valuation Report is an in-depth analysis detailing your home's value as well as a comparison with similar homes in the area
Home Values in the Area
Average Home Value in this Area
Purchase History
| Date | Buyer | Sale Price | Title Company |
|---|---|---|---|
| Venmel 3 Llc | $7,900,000 | -- | |
| Venmel 3 Llc | $7,900,000 | -- | |
| Venmel 8 Llc | $8,600,000 | -- | |
| Venmel 8 Llc | $8,600,000 | -- | |
| Venmel Llc | $9,500,000 | -- | |
| Venmel Llc | $9,500,000 | -- | |
| Jaya Ny Llc | $3,215,000 | -- | |
| Jaya Ny Llc | $3,215,000 | -- | |
| Ttn Realty Holdings Corp | $3,325,000 | -- | |
| Ttn Realty Holdings Corp | $3,325,000 | -- | |
| The One Club For Creativity Inc | $8,900,000 | -- | |
| The One Club For Creativity Inc | $8,900,000 | -- |
Source: Public Records
Mortgage History
| Date | Status | Borrower | Loan Amount |
|---|---|---|---|
| Closed | Venmel 3 Llc | $0 |
Source: Public Records
Tax History Compared to Growth
Tax History
| Year | Tax Paid | Tax Assessment Tax Assessment Total Assessment is a certain percentage of the fair market value that is determined by local assessors to be the total taxable value of land and additions on the property. | Land | Improvement |
|---|---|---|---|---|
| 2025 | $827,666 | $7,633,440 | $823,500 | $6,809,940 |
| 2024 | $827,666 | $7,814,070 | $823,500 | $6,990,570 |
| 2023 | $807,975 | $7,615,440 | $823,500 | $6,791,940 |
| 2022 | $744,450 | $6,921,900 | $823,500 | $6,098,400 |
| 2021 | $711,162 | $6,650,100 | $823,500 | $5,826,600 |
| 2020 | $751,533 | $9,262,350 | $823,500 | $8,438,850 |
| 2019 | $673,187 | $7,274,250 | $823,500 | $6,450,750 |
| 2018 | $650,870 | $6,786,900 | $823,500 | $5,963,400 |
| 2017 | $594,821 | $6,373,800 | $823,500 | $5,550,300 |
| 2016 | $547,107 | $5,815,800 | $823,500 | $4,992,300 |
| 2015 | $224,942 | $5,463,900 | $823,500 | $4,640,400 |
| 2014 | $224,942 | $5,205,150 | $823,500 | $4,381,650 |
Source: Public Records
Map
Nearby Homes
- 450 W 31st St Unit 2N
- 517 W 29th St Unit 5 H
- 517 W 29th St Unit PHD
- 517 W 29th St Unit 6E
- 517 W 29th St Unit 2B
- 517 W 29th St Unit 7D
- 517 W 29th St Unit 2 F
- 517 W 29th St Unit 3D
- 517 W 29th St Unit 8H
- 517 W 29th St Unit 6A
- 517 W 29th St Unit 2E
- 517 W 29th St Unit 3G
- 359 W 30th St Unit 2B
- 522 W 29th St Unit 7-D
- 522 W 29th St Unit 4D
- 522 W 29th St Unit 5A
- 522 W 29th St Unit 5B
- 522 W 29th St Unit B-3
- 522 W 29th St Unit 4A
- 430 W 34th St Unit 5G
- 450 W 31st St Unit Flrs 6 & 7
- 358 10th Ave
- 432-434 W 31st St
- 31ST West St
- 435-401 W 31st St Unit RU
- 435-401 W 31st St
- 29 Areos Unit 6
- 371 9th Ave
- 435 W 31st St Unit FL33-ID1783
- 435 W 31st St Unit 55D
- 435 W 31st St Unit 55-D
- 435 W 31st St Unit FL20-ID1453
- 435 W 31st St Unit FL36-ID1454
- 435 W 31st St Unit FL11-ID1455
- 435 W 31st St Unit FL32-ID1484
- 435 W 31st St Unit FL29-ID1483
- 435 W 31st St Unit FL18-ID1456
- 435 W 31st St
- 435 W 31st St Unit 33 h
- 435 W 31st St Unit 16-S