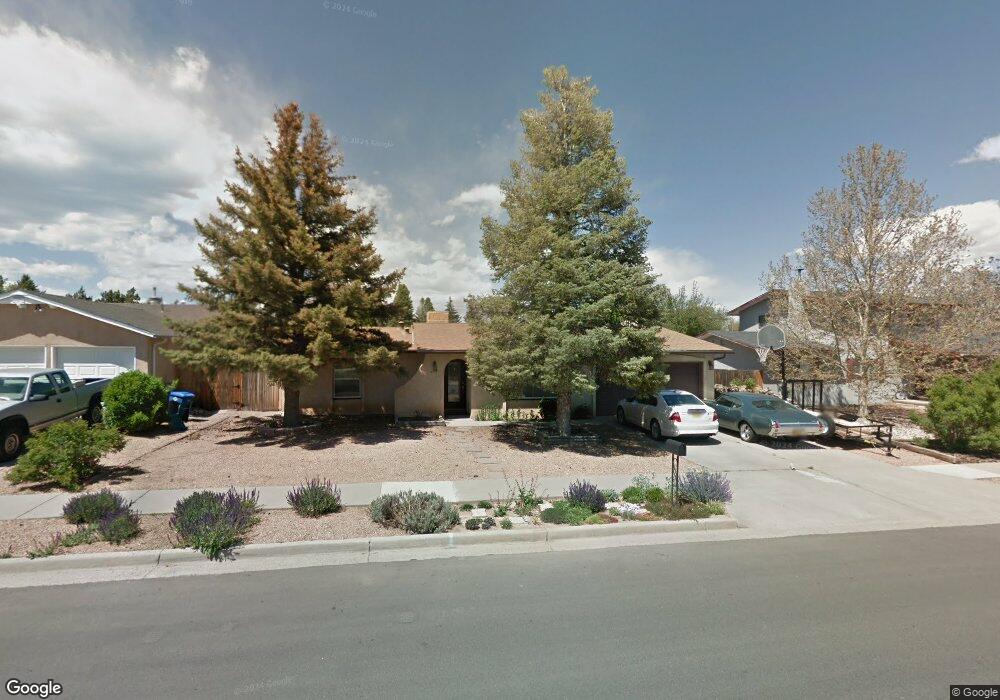
442 Bryce Ave Los Alamos, NM 87544
Estimated Value: $479,000 - $544,000
3
Beds
2
Baths
1,541
Sq Ft
$331/Sq Ft
Est. Value
About This Home
This home is located at 442 Bryce Ave, Los Alamos, NM 87544 and is currently estimated at $509,330, approximately $330 per square foot. 442 Bryce Ave is a home located in Los Alamos County with nearby schools including Chamisa Elementary School, Los Alamos Middle School, and Los Alamos High School.
Ownership History
Date
Name
Owned For
Owner Type
Purchase Details
Closed on
Aug 9, 2017
Sold by
Ramsey John C and Ramsey Smita N
Bought by
Gurule Joseph and Gurule Denise D
Current Estimated Value
Home Financials for this Owner
Home Financials are based on the most recent Mortgage that was taken out on this home.
Original Mortgage
$266,000
Outstanding Balance
$222,374
Interest Rate
4.03%
Mortgage Type
New Conventional
Estimated Equity
$286,956
Create a Home Valuation Report for This Property
The Home Valuation Report is an in-depth analysis detailing your home's value as well as a comparison with similar homes in the area
Home Values in the Area
Average Home Value in this Area
Purchase History
| Date | Buyer | Sale Price | Title Company |
|---|---|---|---|
| Gurule Joseph | -- | None Available |
Source: Public Records
Mortgage History
| Date | Status | Borrower | Loan Amount |
|---|---|---|---|
| Open | Gurule Joseph | $266,000 |
Source: Public Records
Tax History Compared to Growth
Tax History
| Year | Tax Paid | Tax Assessment Tax Assessment Total Assessment is a certain percentage of the fair market value that is determined by local assessors to be the total taxable value of land and additions on the property. | Land | Improvement |
|---|---|---|---|---|
| 2025 | $2,675 | $112,690 | $27,900 | $84,790 |
| 2024 | $2,578 | $109,410 | $27,500 | $81,910 |
| 2023 | $2,550 | $106,220 | $27,090 | $79,130 |
| 2022 | $2,491 | $103,130 | $26,560 | $76,570 |
| 2021 | $2,411 | $100,120 | $26,110 | $74,010 |
| 2020 | $2,385 | $97,210 | $25,790 | $71,420 |
| 2019 | $2,352 | $94,380 | $25,050 | $69,330 |
| 2018 | $2,299 | $91,630 | $24,380 | $67,250 |
| 2017 | $1,656 | $67,640 | $21,500 | $46,140 |
| 2016 | $1,552 | $65,670 | $21,500 | $44,170 |
| 2015 | $1,481 | $62,620 | $21,060 | $41,560 |
| 2014 | $1,351 | $61,830 | $21,060 | $40,770 |
| 2013 | $1,424 | $65,540 | $22,890 | $42,650 |
| 2011 | $1,466 | $68,050 | $22,850 | $45,200 |
Source: Public Records
Map
Nearby Homes