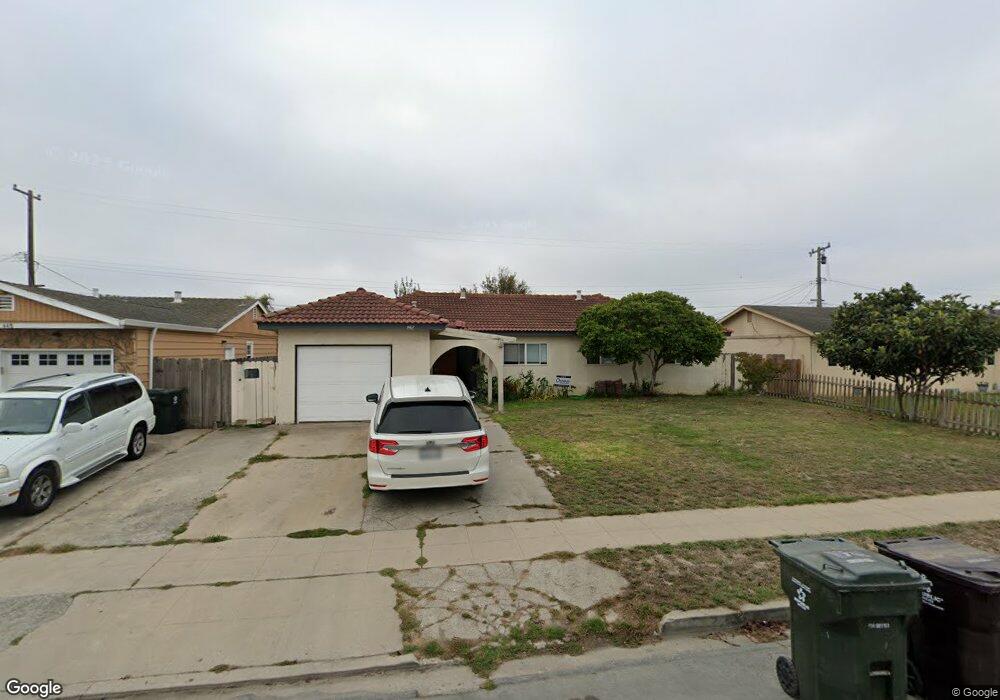
442 Chaparral St Salinas, CA 93906
Harden Ranch NeighborhoodEstimated Value: $619,000 - $658,000
4
Beds
2
Baths
1,215
Sq Ft
$519/Sq Ft
Est. Value
About This Home
This home is located at 442 Chaparral St, Salinas, CA 93906 and is currently estimated at $630,447, approximately $518 per square foot. 442 Chaparral St is a home located in Monterey County with nearby schools including El Gabilan Elementary School, Natividad Elementary School, and Loma Vista Elementary School.
Ownership History
Date
Name
Owned For
Owner Type
Purchase Details
Closed on
Apr 7, 2020
Sold by
Barraza Jorge and Serrano Criselia G
Bought by
Serrano Criselia and Barraza Jorge
Current Estimated Value
Purchase Details
Closed on
Mar 21, 2015
Sold by
Serrano Criselia and Serrano Criselia G
Bought by
Barraza Jorge and Serrano Criselia G
Home Financials for this Owner
Home Financials are based on the most recent Mortgage that was taken out on this home.
Original Mortgage
$194,000
Interest Rate
3.71%
Mortgage Type
New Conventional
Create a Home Valuation Report for This Property
The Home Valuation Report is an in-depth analysis detailing your home's value as well as a comparison with similar homes in the area
Home Values in the Area
Average Home Value in this Area
Purchase History
| Date | Buyer | Sale Price | Title Company |
|---|---|---|---|
| Serrano Criselia | -- | None Available | |
| Barraza Jorge | -- | First American Title |
Source: Public Records
Mortgage History
| Date | Status | Borrower | Loan Amount |
|---|---|---|---|
| Closed | Barraza Jorge | $194,000 |
Source: Public Records
Tax History
| Year | Tax Paid | Tax Assessment Tax Assessment Total Assessment is a certain percentage of the fair market value that is determined by local assessors to be the total taxable value of land and additions on the property. | Land | Improvement |
|---|---|---|---|---|
| 2025 | $2,351 | $164,260 | $59,726 | $104,534 |
| 2024 | $2,351 | $161,040 | $58,555 | $102,485 |
| 2023 | $1,857 | $157,883 | $57,407 | $100,476 |
| 2022 | $1,787 | $154,788 | $56,282 | $98,506 |
| 2021 | $2,167 | $151,754 | $55,179 | $96,575 |
| 2020 | $2,126 | $150,199 | $54,614 | $95,585 |
| 2019 | $2,073 | $147,255 | $53,544 | $93,711 |
| 2018 | $2,003 | $144,369 | $52,495 | $91,874 |
| 2017 | $1,860 | $141,539 | $51,466 | $90,073 |
| 2016 | $1,636 | $138,764 | $50,457 | $88,307 |
| 2015 | $1,649 | $136,681 | $49,700 | $86,981 |
| 2014 | $1,824 | $134,005 | $48,727 | $85,278 |
Source: Public Records
Map
Nearby Homes
- 1443 Parsons Ave
- 1421 Amador Cir
- 323 Chaparral St
- 1445 Amador Cir
- 208 Diablo Dr
- 336 Rainier Dr
- 276 Noice Dr
- 607 Calaveras Dr
- 1667 Klamath Dr
- 1527 Atherton Way
- 15 Saint Francis Way
- 24 Saint Francis Way
- 634 Yreka Dr
- 1838 Lancashire Dr
- 730 N Main St
- 1671 Cambrian Dr
- 427 W Laurel Dr Unit A
- 1823 Broadway Dr
- 1780 Truckee Way
- 217 Iris Dr
- 448 Chaparral St
- 438 Chaparral St
- 447 Sonora Way
- 443 Sonora Way Unit 6
- 451 Sonora Way
- 452 Chaparral St
- 434 Chaparral St
- 441 Chaparral St
- 439 Sonora Way
- 445 Chaparral St
- 455 Sonora Way
- 437 Chaparral St
- 449 Chaparral St
- 456 Chaparral St
- 428 Chaparral St
- 433 Chaparral St
- 459 Sonora Way
- 435 Sonora Way
- 453 Chaparral St
- 448 Sonora Way
Your Personal Tour Guide
Ask me questions while you tour the home.