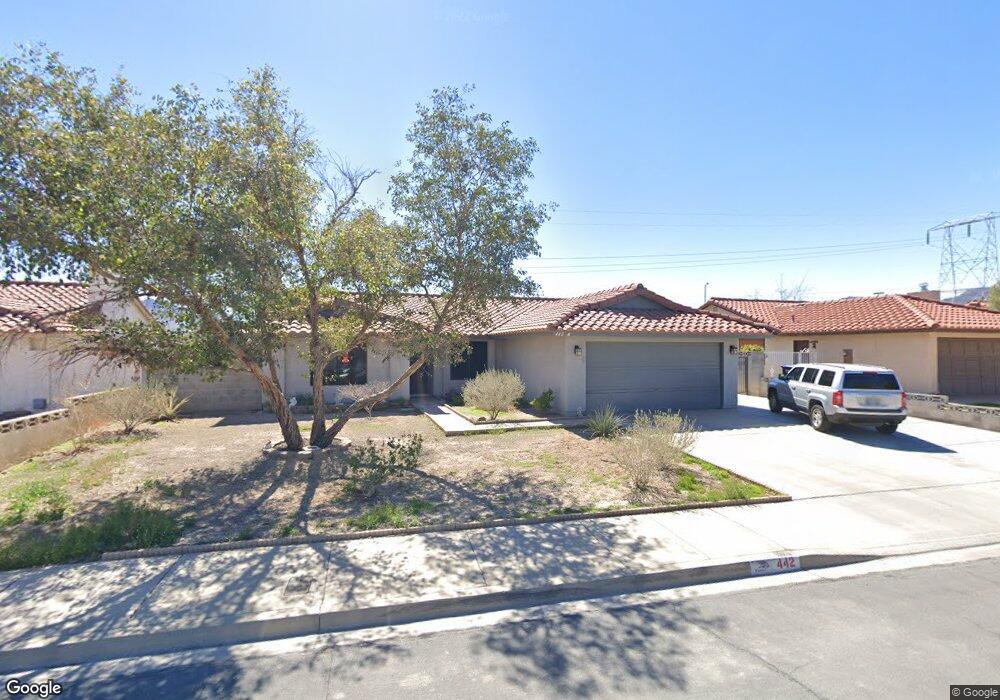
442 Concord Way Henderson, NV 89015
Valley View NeighborhoodEstimated Value: $377,000 - $427,000
4
Beds
2
Baths
1,426
Sq Ft
$277/Sq Ft
Est. Value
About This Home
This home is located at 442 Concord Way, Henderson, NV 89015 and is currently estimated at $395,706, approximately $277 per square foot. 442 Concord Way is a home located in Clark County with nearby schools including Sue H. Morrow Elementary School, B Mahlon Brown Academy of International Studies, and Basic Academy of International Studies.
Ownership History
Date
Name
Owned For
Owner Type
Purchase Details
Closed on
Jul 7, 2006
Sold by
Lindley Brenda A
Bought by
Lindley Thomas P and Lindley Brenda A
Current Estimated Value
Home Financials for this Owner
Home Financials are based on the most recent Mortgage that was taken out on this home.
Original Mortgage
$202,500
Outstanding Balance
$120,286
Interest Rate
6.66%
Mortgage Type
New Conventional
Estimated Equity
$275,420
Purchase Details
Closed on
Apr 30, 2003
Sold by
Lindley Thomas P
Bought by
Lindley Brenda A
Home Financials for this Owner
Home Financials are based on the most recent Mortgage that was taken out on this home.
Original Mortgage
$145,000
Interest Rate
5.61%
Mortgage Type
Unknown
Purchase Details
Closed on
Jan 5, 2000
Sold by
Ishman Kathy D
Bought by
Ishman Esturs and Ishman Margie
Create a Home Valuation Report for This Property
The Home Valuation Report is an in-depth analysis detailing your home's value as well as a comparison with similar homes in the area
Home Values in the Area
Average Home Value in this Area
Purchase History
| Date | Buyer | Sale Price | Title Company |
|---|---|---|---|
| Lindley Thomas P | -- | Fidelity National Title | |
| Lindley Brenda A | -- | Old Republic Title Company | |
| Lindley Brenda A | $145,000 | Old Republic Title Company | |
| Ishman Esturs | -- | -- |
Source: Public Records
Mortgage History
| Date | Status | Borrower | Loan Amount |
|---|---|---|---|
| Open | Lindley Thomas P | $202,500 | |
| Previous Owner | Lindley Brenda A | $145,000 |
Source: Public Records
Tax History Compared to Growth
Tax History
| Year | Tax Paid | Tax Assessment Tax Assessment Total Assessment is a certain percentage of the fair market value that is determined by local assessors to be the total taxable value of land and additions on the property. | Land | Improvement |
|---|---|---|---|---|
| 2025 | $1,119 | $62,888 | $28,700 | $34,188 |
| 2024 | $1,087 | $62,888 | $28,700 | $34,188 |
| 2023 | $876 | $62,287 | $29,050 | $33,237 |
| 2022 | $1,055 | $56,187 | $25,550 | $30,637 |
| 2021 | $1,024 | $51,907 | $22,400 | $29,507 |
| 2020 | $992 | $50,268 | $20,650 | $29,618 |
| 2019 | $980 | $48,087 | $18,550 | $29,537 |
| 2018 | $935 | $43,627 | $15,050 | $28,577 |
| 2017 | $1,251 | $43,154 | $14,000 | $29,154 |
| 2016 | $876 | $37,107 | $7,350 | $29,757 |
| 2015 | $873 | $33,431 | $7,350 | $26,081 |
| 2014 | $848 | $29,149 | $6,650 | $22,499 |
Source: Public Records
Map
Nearby Homes
- 403 Woodridge Dr
- 616 Lively Fiesta Way
- 834 Dulce Fountain Way
- 488 Ylang Place
- 485 Ylang Place
- Cambridge Plan at Juniper Trails
- Albany Plan at Juniper Trails
- Bedford Plan at Juniper Trails
- Griffin Plan at Juniper Trails
- Barclay Plan at Juniper Trails
- 671 Anemone Ln
- 481 Ylang Place
- 668 Tiarella Ln
- 479 Ylang Place
- 477 Ylang Place
- 664 Foam Flower Ln
- 662 Foam Flower Ln
- 480 Filaree Place
- 840 Candido Garcia Ave
- 489 Filaree Place
- 440 Concord Way
- 444 Concord Way
- 438 Concord Way
- 446 Concord Way
- 443 Concord Way
- 441 Concord Way
- 447 Concord Way
- 448 Concord Way
- 439 Concord Way
- 449 Concord Way
- 408 Saratoga Ct
- 437 Concord Way
- 450 Concord Way
- 409 Monmouth Ct
- 409 Saratoga Ct
- 435 Concord Way
- 407 Monmouth Ct
- 410 Saratoga Ct
- 452 Concord Way
- 453 Concord Way