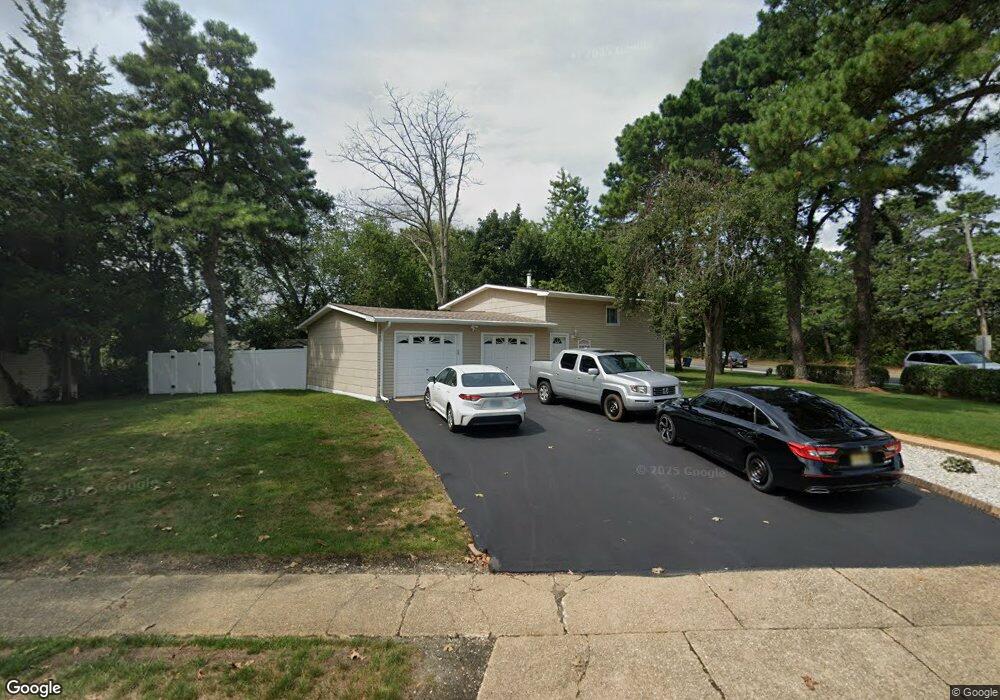
442 Dover Rd Toms River, NJ 08757
Estimated Value: $388,242 - $442,000
3
Beds
1
Bath
1,344
Sq Ft
$304/Sq Ft
Est. Value
About This Home
This home is located at 442 Dover Rd, Toms River, NJ 08757 and is currently estimated at $409,061, approximately $304 per square foot. 442 Dover Rd is a home located in Ocean County with nearby schools including St Joseph Grade School, Ambassador Christian Academy, and Ocean Academy.
Ownership History
Date
Name
Owned For
Owner Type
Purchase Details
Closed on
Feb 11, 2005
Sold by
Quinones Gloria C
Bought by
Yost Michael
Current Estimated Value
Home Financials for this Owner
Home Financials are based on the most recent Mortgage that was taken out on this home.
Original Mortgage
$164,925
Outstanding Balance
$83,719
Interest Rate
5.73%
Mortgage Type
Stand Alone First
Estimated Equity
$325,343
Purchase Details
Closed on
Oct 20, 2003
Sold by
F & S Porperties Llc
Bought by
Quinones Gloria C
Purchase Details
Closed on
Aug 5, 2003
Sold by
Mccormack James S and Mccormack Barbara J
Bought by
442 Dover Road Land Trust
Create a Home Valuation Report for This Property
The Home Valuation Report is an in-depth analysis detailing your home's value as well as a comparison with similar homes in the area
Home Values in the Area
Average Home Value in this Area
Purchase History
| Date | Buyer | Sale Price | Title Company |
|---|---|---|---|
| Yost Michael | $219,900 | -- | |
| Quinones Gloria C | $180,000 | -- | |
| 442 Dover Road Land Trust | $90,900 | -- |
Source: Public Records
Mortgage History
| Date | Status | Borrower | Loan Amount |
|---|---|---|---|
| Open | Yost Michael | $164,925 | |
| Closed | Yost Michael | $21,990 |
Source: Public Records
Tax History Compared to Growth
Tax History
| Year | Tax Paid | Tax Assessment Tax Assessment Total Assessment is a certain percentage of the fair market value that is determined by local assessors to be the total taxable value of land and additions on the property. | Land | Improvement |
|---|---|---|---|---|
| 2025 | $5,432 | $165,300 | $56,900 | $108,400 |
| 2024 | $5,240 | $165,300 | $56,900 | $108,400 |
| 2023 | $5,106 | $165,300 | $56,900 | $108,400 |
| 2022 | $5,106 | $165,300 | $56,900 | $108,400 |
| 2021 | $4,851 | $165,300 | $56,900 | $108,400 |
| 2020 | $4,934 | $165,300 | $56,900 | $108,400 |
| 2019 | $4,886 | $165,300 | $56,900 | $108,400 |
| 2018 | $4,799 | $165,300 | $56,900 | $108,400 |
| 2017 | $4,733 | $165,300 | $56,900 | $108,400 |
| 2016 | $4,618 | $165,300 | $56,900 | $108,400 |
| 2015 | $4,962 | $227,300 | $100,000 | $127,300 |
| 2014 | $4,776 | $227,300 | $100,000 | $127,300 |
Source: Public Records
Map
Nearby Homes