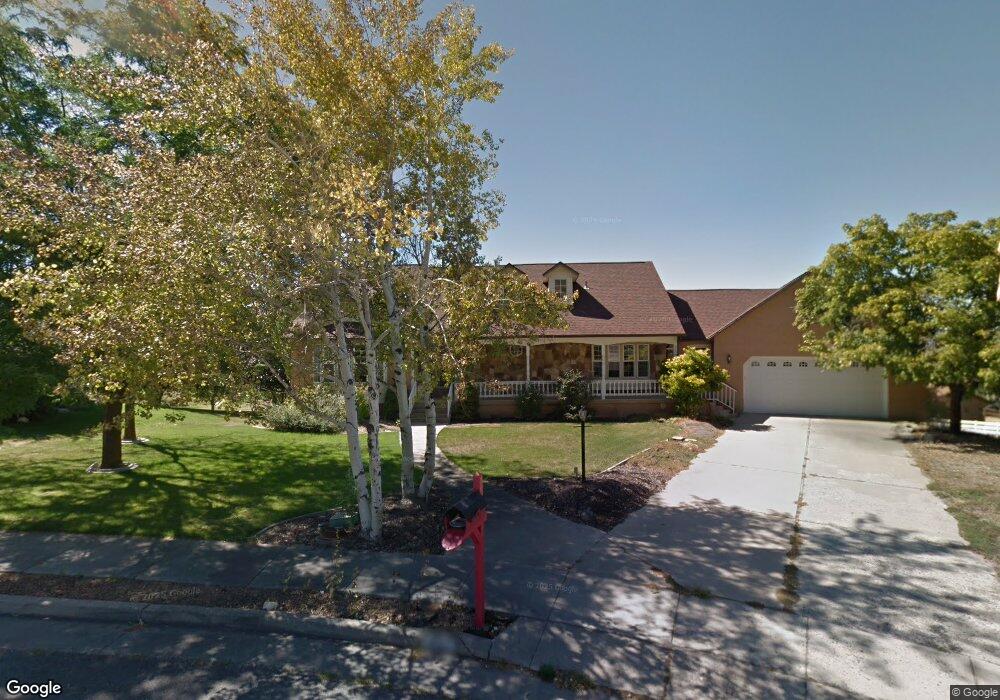
442 E Vons Way Providence, UT 84332
Estimated Value: $392,000 - $534,000
4
Beds
2
Baths
2,182
Sq Ft
$199/Sq Ft
Est. Value
About This Home
This home is located at 442 E Vons Way, Providence, UT 84332 and is currently estimated at $433,697, approximately $198 per square foot. 442 E Vons Way is a home located in Cache County with nearby schools including Providence School, Spring Creek Middle School, and South Cache Middle School.
Ownership History
Date
Name
Owned For
Owner Type
Purchase Details
Closed on
Nov 5, 2021
Sold by
Cardall Holdings Llc
Bought by
Hendricks Shaun Reese and Hamsley Becky A
Current Estimated Value
Home Financials for this Owner
Home Financials are based on the most recent Mortgage that was taken out on this home.
Original Mortgage
$343,660
Outstanding Balance
$313,075
Interest Rate
2.88%
Mortgage Type
FHA
Estimated Equity
$120,622
Purchase Details
Closed on
Sep 30, 2016
Sold by
Cardall Mike and Cardall Kelli
Bought by
Cardall Holdings Llc
Purchase Details
Closed on
Aug 10, 2005
Sold by
Spillman Technologies Inc
Bought by
Cardall Mike and Cardall Kelli
Home Financials for this Owner
Home Financials are based on the most recent Mortgage that was taken out on this home.
Original Mortgage
$163,638
Interest Rate
5.48%
Mortgage Type
FHA
Create a Home Valuation Report for This Property
The Home Valuation Report is an in-depth analysis detailing your home's value as well as a comparison with similar homes in the area
Home Values in the Area
Average Home Value in this Area
Purchase History
| Date | Buyer | Sale Price | Title Company |
|---|---|---|---|
| Hendricks Shaun Reese | -- | Northern Title Company | |
| Cardall Holdings Llc | -- | Attorney | |
| Cardall Mike | -- | Cache Title Company | |
| Spillman Technologies Inc | -- | Cache Title Company |
Source: Public Records
Mortgage History
| Date | Status | Borrower | Loan Amount |
|---|---|---|---|
| Open | Hendricks Shaun Reese | $343,660 | |
| Previous Owner | Cardall Mike | $163,638 |
Source: Public Records
Tax History
| Year | Tax Paid | Tax Assessment Tax Assessment Total Assessment is a certain percentage of the fair market value that is determined by local assessors to be the total taxable value of land and additions on the property. | Land | Improvement |
|---|---|---|---|---|
| 2025 | $1,580 | $221,470 | $0 | $0 |
| 2024 | $1,690 | $220,460 | $0 | $0 |
| 2023 | $1,775 | $218,185 | $0 | $0 |
| 2022 | $1,880 | $218,180 | $0 | $0 |
| 2021 | $1,833 | $325,920 | $90,000 | $235,920 |
| 2020 | $1,738 | $286,600 | $90,000 | $196,600 |
| 2019 | $1,509 | $235,640 | $90,000 | $145,640 |
| 2018 | $1,182 | $188,424 | $65,000 | $123,424 |
| 2017 | $1,142 | $96,360 | $0 | $0 |
| 2016 | $1,154 | $96,360 | $0 | $0 |
| 2015 | $1,157 | $96,360 | $0 | $0 |
| 2014 | $1,099 | $93,825 | $0 | $0 |
| 2013 | -- | $95,200 | $0 | $0 |
Source: Public Records
Map
Nearby Homes
- 615 Foxridge Dr
- 215 E 200 N
- 585 Maple Hollow Ln
- 240 Bugle Way
- 118 N Sherwood Dr
- 129 N Sherwood Dr Unit 5
- 602 E 300 N
- 385 N 300 E
- 151 E 360 N
- 76 E Springs Ln
- 55 Mountain View Cir
- 304 N Sherwood Dr
- 201 E 580 N
- 196 N 850 E Unit 29
- 810 E Spring Creek Pkwy
- 295 S Main St
- 329 N Springs Ln
- 510 Spring Creek Rd
- 840 E Spring Creek Pkwy
- 275 N Mountain Ln W
Your Personal Tour Guide
Ask me questions while you tour the home.