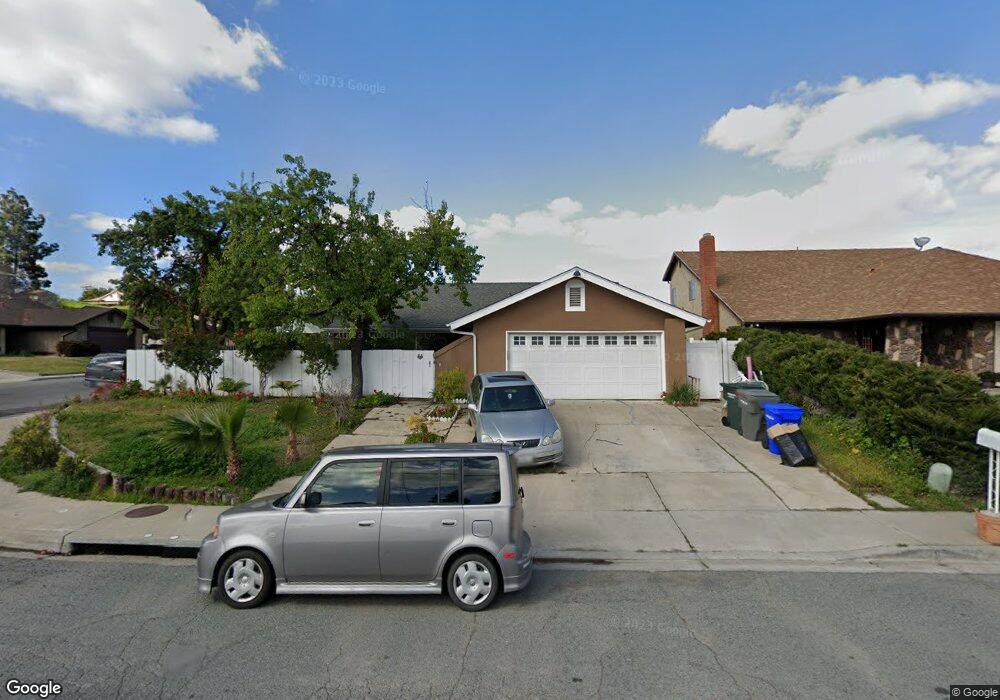
442 Kempton St Spring Valley, CA 91977
Estimated Value: $746,530 - $819,000
3
Beds
2
Baths
1,538
Sq Ft
$501/Sq Ft
Est. Value
About This Home
This home is located at 442 Kempton St, Spring Valley, CA 91977 and is currently estimated at $770,883, approximately $501 per square foot. 442 Kempton St is a home located in San Diego County with nearby schools including La Presa Elementary School, Science, Technology, Engineering, Arts, And Math Academy, and Mount Miguel High School.
Ownership History
Date
Name
Owned For
Owner Type
Purchase Details
Closed on
Dec 22, 2020
Sold by
Theus Jacques
Bought by
Theus Jacques and Theus Amber
Current Estimated Value
Home Financials for this Owner
Home Financials are based on the most recent Mortgage that was taken out on this home.
Original Mortgage
$380,000
Outstanding Balance
$338,313
Interest Rate
2.7%
Mortgage Type
VA
Estimated Equity
$432,570
Purchase Details
Closed on
Oct 3, 2011
Sold by
Canter Da Fund 1 Llc
Bought by
Theus Jacques
Home Financials for this Owner
Home Financials are based on the most recent Mortgage that was taken out on this home.
Original Mortgage
$280,000
Interest Rate
3.87%
Mortgage Type
Purchase Money Mortgage
Purchase Details
Closed on
Aug 4, 2011
Sold by
Hadsell Richard A and Hadsell Nancy H
Bought by
Canter Da Fund I Llc
Home Financials for this Owner
Home Financials are based on the most recent Mortgage that was taken out on this home.
Original Mortgage
$280,000
Interest Rate
3.87%
Mortgage Type
Purchase Money Mortgage
Create a Home Valuation Report for This Property
The Home Valuation Report is an in-depth analysis detailing your home's value as well as a comparison with similar homes in the area
Home Values in the Area
Average Home Value in this Area
Purchase History
| Date | Buyer | Sale Price | Title Company |
|---|---|---|---|
| Theus Jacques | -- | Stewart Title Guaranty Co | |
| Theus Jacques | $280,000 | Ticor Title Company | |
| Canter Da Fund I Llc | $203,000 | None Available |
Source: Public Records
Mortgage History
| Date | Status | Borrower | Loan Amount |
|---|---|---|---|
| Open | Theus Jacques | $380,000 | |
| Closed | Theus Jacques | $280,000 |
Source: Public Records
Tax History
| Year | Tax Paid | Tax Assessment Tax Assessment Total Assessment is a certain percentage of the fair market value that is determined by local assessors to be the total taxable value of land and additions on the property. | Land | Improvement |
|---|---|---|---|---|
| 2025 | $4,701 | $351,686 | $182,875 | $168,811 |
| 2024 | $4,701 | $344,791 | $179,290 | $165,501 |
| 2023 | $4,553 | $338,031 | $175,775 | $162,256 |
| 2022 | $4,477 | $331,404 | $172,329 | $159,075 |
| 2021 | $2,692 | $324,906 | $168,950 | $155,956 |
| 2020 | $2,609 | $321,575 | $167,218 | $154,357 |
| 2019 | $2,581 | $315,271 | $163,940 | $151,331 |
| 2018 | $2,512 | $309,090 | $160,726 | $148,364 |
| 2017 | $831 | $303,030 | $157,575 | $145,455 |
| 2016 | $2,364 | $297,089 | $154,486 | $142,603 |
| 2015 | $2,334 | $292,627 | $152,166 | $140,461 |
| 2014 | $2,284 | $286,896 | $149,186 | $137,710 |
Source: Public Records
Map
Nearby Homes
- 9125 Akard St
- 426 Sacramento Ave
- 661 Concepcion Ave
- 341 Paraiso Ave
- 9421 Avenida Acero
- 628 Paraiso Ave
- 534 Ramona Ave
- 734 Grand Ave
- 948 Gillespie Dr
- 817 Sacramento Ave
- 363 Maria Ave
- 757 Grand Ave
- 166 Lakeview Ave
- 8766 Kelso St
- 1034 Leland St Unit 14
- 0 Grand Ave Unit PW25084786
- 557 Parkbrook St
- 903 Concepcion Ave
- 8840 Leigh Ave Unit 12
- 524 Parkbrook St
- 460 Kempton St
- 404 Kurdson Way
- 410 Kurdson Way
- 468 Kempton St
- 9137 Outinda St
- 9133 Outinda St
- 447 Kempton St
- 451 Kempton St
- 418 Kurdson Way
- 9129 Outinda St
- 506 Kempton St
- 437 Kempton St
- 9209 San Diego St
- 9125 Outinda St
- 428 Kurdson Way
- 429 Kempton St
- 9118 Outinda St
- 514 Kempton St
- 9121 Outinda St
- 454 Felicita Ave
Your Personal Tour Guide
Ask me questions while you tour the home.