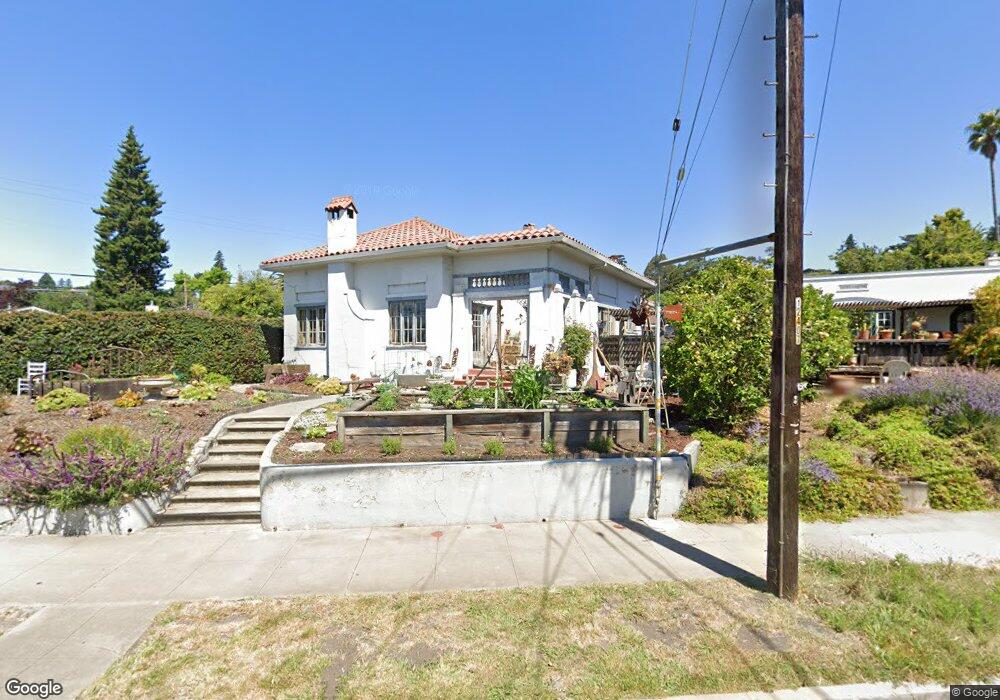
442 King St Santa Cruz, CA 95060
King Street NeighborhoodEstimated Value: $1,661,000 - $1,763,247
2
Beds
2
Baths
1,914
Sq Ft
$889/Sq Ft
Est. Value
About This Home
This home is located at 442 King St, Santa Cruz, CA 95060 and is currently estimated at $1,701,562, approximately $889 per square foot. 442 King St is a home located in Santa Cruz County with nearby schools including Westlake Elementary School, Mission Hill Middle School, and Santa Cruz High School.
Ownership History
Date
Name
Owned For
Owner Type
Purchase Details
Closed on
Mar 6, 2014
Sold by
Kirschen Terri C
Bought by
Kirschen Terri C and Terri C Kirschen Trust
Current Estimated Value
Purchase Details
Closed on
Nov 15, 2010
Sold by
Kirschen Barry
Bought by
Kirschen Terri C
Purchase Details
Closed on
Jul 29, 1994
Sold by
Thacher Carry C and Hardy Elva F
Bought by
Kirschen Barry and Kirschen Terri
Home Financials for this Owner
Home Financials are based on the most recent Mortgage that was taken out on this home.
Original Mortgage
$175,550
Interest Rate
8.51%
Purchase Details
Closed on
Jul 28, 1994
Sold by
Kirschen Barry and Kirschen Terri
Bought by
Kirschen Barry and Kirschen Terri C
Home Financials for this Owner
Home Financials are based on the most recent Mortgage that was taken out on this home.
Original Mortgage
$175,550
Interest Rate
8.51%
Create a Home Valuation Report for This Property
The Home Valuation Report is an in-depth analysis detailing your home's value as well as a comparison with similar homes in the area
Home Values in the Area
Average Home Value in this Area
Purchase History
| Date | Buyer | Sale Price | Title Company |
|---|---|---|---|
| Kirschen Terri C | -- | None Available | |
| Kirschen Terri C | -- | None Available | |
| Kirschen Barry | $195,500 | -- | |
| Kirschen Barry | -- | Santa Cruz Title |
Source: Public Records
Mortgage History
| Date | Status | Borrower | Loan Amount |
|---|---|---|---|
| Closed | Kirschen Barry | $175,550 |
Source: Public Records
Tax History Compared to Growth
Tax History
| Year | Tax Paid | Tax Assessment Tax Assessment Total Assessment is a certain percentage of the fair market value that is determined by local assessors to be the total taxable value of land and additions on the property. | Land | Improvement |
|---|---|---|---|---|
| 2025 | $3,862 | $328,392 | $218,366 | $110,026 |
| 2023 | $3,817 | $315,639 | $209,886 | $105,753 |
| 2022 | $3,776 | $309,451 | $205,771 | $103,680 |
| 2021 | $3,701 | $303,383 | $201,736 | $101,647 |
| 2020 | $3,674 | $300,272 | $199,668 | $100,604 |
| 2019 | $3,586 | $294,384 | $195,752 | $98,632 |
| 2018 | $3,547 | $288,612 | $191,914 | $96,698 |
| 2017 | $3,503 | $282,953 | $188,151 | $94,802 |
| 2016 | $3,322 | $277,405 | $184,462 | $92,943 |
| 2015 | $3,172 | $273,238 | $181,691 | $91,547 |
| 2014 | $3,120 | $267,886 | $178,132 | $89,754 |
Source: Public Records
Map
Nearby Homes
- 449 High St
- 603 Mission St
- 1103 Mission St
- 623 High St
- 233 Rigg St
- 1212 Laurent St
- 1124 Laurel St
- 260 High St Unit 206
- 260 High St Unit 204
- 350 Highland Ave
- 807 Laurel St
- 514 Washington St
- 121 Acadia Ave
- 148 Myrtle St
- 309 Village Cir
- 2030 N Pacific Ave Unit 314
- 120 Maple St
- 148 Mason St
- 102 Tree Frog Ln
- 116 Shelter Lagoon Dr