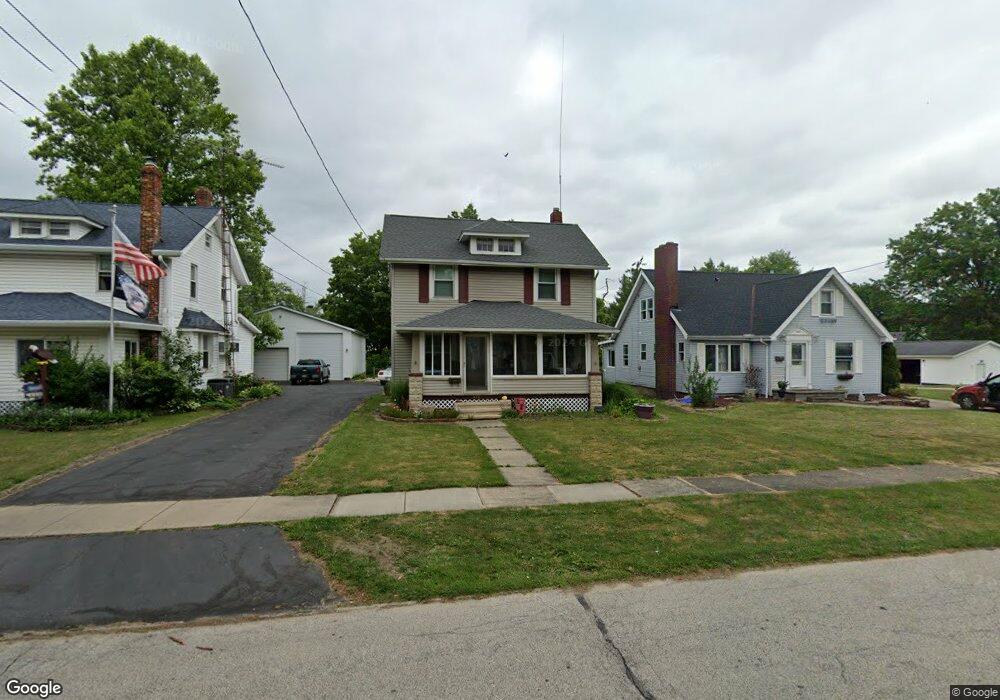
442 Myrtle St Ravenna, OH 44266
Estimated Value: $160,131 - $188,000
2
Beds
1
Bath
1,277
Sq Ft
$135/Sq Ft
Est. Value
About This Home
This home is located at 442 Myrtle St, Ravenna, OH 44266 and is currently estimated at $171,783, approximately $134 per square foot. 442 Myrtle St is a home located in Portage County with nearby schools including West Main Elementary School, West Park Elementary School, and Brown Middle School.
Ownership History
Date
Name
Owned For
Owner Type
Purchase Details
Closed on
Oct 10, 2014
Sold by
Myers Steven A and Rock Sharon A
Bought by
Rock Sharon A
Current Estimated Value
Purchase Details
Closed on
Aug 30, 2011
Sold by
Neff Sharon A and Myers Sharon A
Bought by
Myers Sharon A and Myers Steven A
Purchase Details
Closed on
Nov 30, 1994
Sold by
Smith Camella K
Bought by
Hurd Todd A and Hurd Tammy G
Home Financials for this Owner
Home Financials are based on the most recent Mortgage that was taken out on this home.
Original Mortgage
$60,150
Interest Rate
8.91%
Mortgage Type
VA
Create a Home Valuation Report for This Property
The Home Valuation Report is an in-depth analysis detailing your home's value as well as a comparison with similar homes in the area
Home Values in the Area
Average Home Value in this Area
Purchase History
| Date | Buyer | Sale Price | Title Company |
|---|---|---|---|
| Rock Sharon A | -- | None Available | |
| Myers Sharon A | -- | None Available | |
| Hurd Todd A | $59,000 | -- |
Source: Public Records
Mortgage History
| Date | Status | Borrower | Loan Amount |
|---|---|---|---|
| Closed | Hurd Todd A | $60,150 |
Source: Public Records
Tax History Compared to Growth
Tax History
| Year | Tax Paid | Tax Assessment Tax Assessment Total Assessment is a certain percentage of the fair market value that is determined by local assessors to be the total taxable value of land and additions on the property. | Land | Improvement |
|---|---|---|---|---|
| 2024 | $1,708 | $46,910 | $5,360 | $41,550 |
| 2023 | $1,682 | $37,840 | $5,360 | $32,480 |
| 2022 | $1,682 | $37,840 | $5,360 | $32,480 |
| 2021 | $1,684 | $37,840 | $5,360 | $32,480 |
| 2020 | $1,570 | $31,330 | $5,360 | $25,970 |
| 2019 | $1,572 | $31,330 | $5,360 | $25,970 |
| 2018 | $1,356 | $25,550 | $6,790 | $18,760 |
| 2017 | $1,356 | $25,550 | $6,790 | $18,760 |
| 2016 | $1,274 | $25,550 | $6,790 | $18,760 |
| 2015 | $1,276 | $25,550 | $6,790 | $18,760 |
| 2014 | $1,275 | $25,550 | $6,790 | $18,760 |
| 2013 | $1,266 | $25,550 | $6,790 | $18,760 |
Source: Public Records
Map
Nearby Homes
- 451 Pratt St
- 450 S Walnut St
- 250 Lawrence St
- 159 E Harris Ave
- 448 Woodland St
- 537 Ohio Ave
- 452 Mill Rd
- 347 Elm St
- 377 Maple St
- 247 King St
- 208 King St
- 656 W Highland Ave
- 646 3rd St
- 825 W Highland Ave
- 856 W Main St
- 110 Oakwood St
- 6235 Gladys St Unit 4
- 1347 Harding Ave Unit 7A
- 668 Westbrook Ct
- 1024 W Riddle Ave