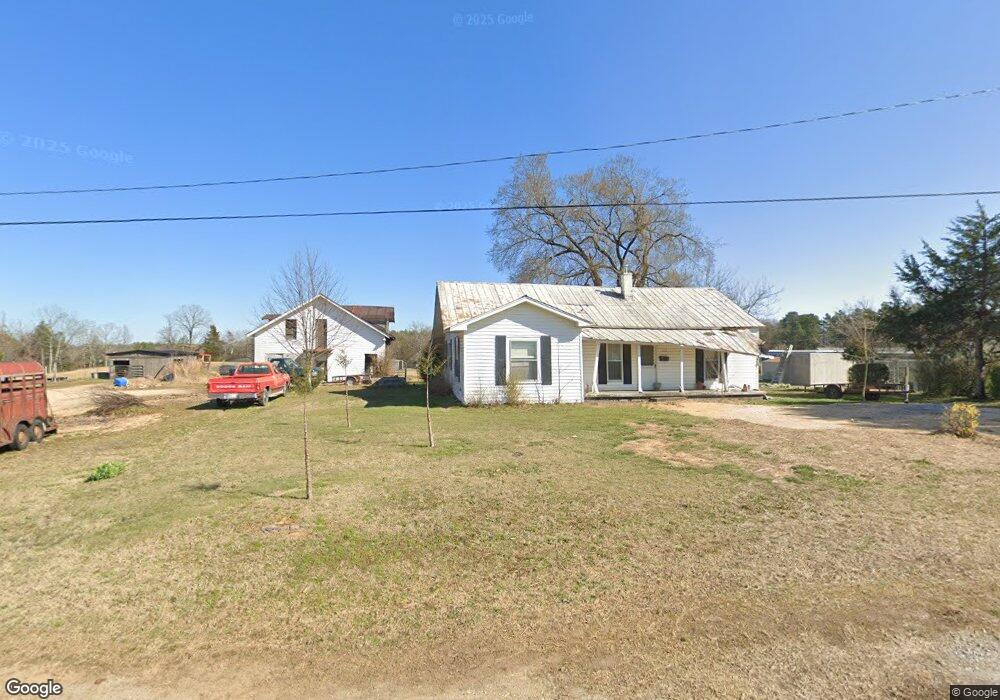
442 Roney Ave Hohenwald, TN 38462
Estimated Value: $196,026 - $229,000
2
Beds
1
Bath
1,500
Sq Ft
$141/Sq Ft
Est. Value
About This Home
This home is located at 442 Roney Ave, Hohenwald, TN 38462 and is currently estimated at $212,009, approximately $141 per square foot. 442 Roney Ave is a home located in Lewis County with nearby schools including Lewis County Elementary School, Lewis County Intermediate School, and Lewis County Middle School.
Ownership History
Date
Name
Owned For
Owner Type
Purchase Details
Closed on
Dec 8, 2017
Sold by
Cagle Charles Thomas
Bought by
Cagle Tommy L
Current Estimated Value
Home Financials for this Owner
Home Financials are based on the most recent Mortgage that was taken out on this home.
Original Mortgage
$30,961
Interest Rate
3.9%
Mortgage Type
New Conventional
Purchase Details
Closed on
Mar 10, 1987
Bought by
Cagle Danny Mattie P
Purchase Details
Closed on
Mar 27, 1982
Bought by
Cagle Danny Mattie P
Create a Home Valuation Report for This Property
The Home Valuation Report is an in-depth analysis detailing your home's value as well as a comparison with similar homes in the area
Home Values in the Area
Average Home Value in this Area
Purchase History
| Date | Buyer | Sale Price | Title Company |
|---|---|---|---|
| Cagle Tommy L | $30,000 | -- | |
| Cagle Charles K | $30,000 | -- | |
| Cagle Danny Mattie P | $9,000 | -- | |
| Cagle Danny Mattie P | -- | -- |
Source: Public Records
Mortgage History
| Date | Status | Borrower | Loan Amount |
|---|---|---|---|
| Closed | Cagle Charles K | $30,961 |
Source: Public Records
Tax History Compared to Growth
Tax History
| Year | Tax Paid | Tax Assessment Tax Assessment Total Assessment is a certain percentage of the fair market value that is determined by local assessors to be the total taxable value of land and additions on the property. | Land | Improvement |
|---|---|---|---|---|
| 2025 | -- | $51,200 | $0 | $0 |
| 2024 | -- | $24,375 | $6,575 | $17,800 |
| 2023 | $734 | $24,375 | $6,575 | $17,800 |
| 2022 | $734 | $24,375 | $6,575 | $17,800 |
| 2021 | $734 | $24,375 | $6,575 | $17,800 |
| 2020 | $459 | $24,375 | $6,575 | $17,800 |
| 2019 | $637 | $17,475 | $5,975 | $11,500 |
| 2018 | $502 | $17,475 | $5,975 | $11,500 |
| 2017 | $880 | $13,225 | $11,700 | $1,525 |
| 2016 | $880 | $23,200 | $11,700 | $11,500 |
| 2015 | -- | $23,200 | $11,700 | $11,500 |
| 2014 | -- | $23,200 | $11,700 | $11,500 |
| 2013 | -- | $21,775 | $0 | $0 |
Source: Public Records
Map
Nearby Homes