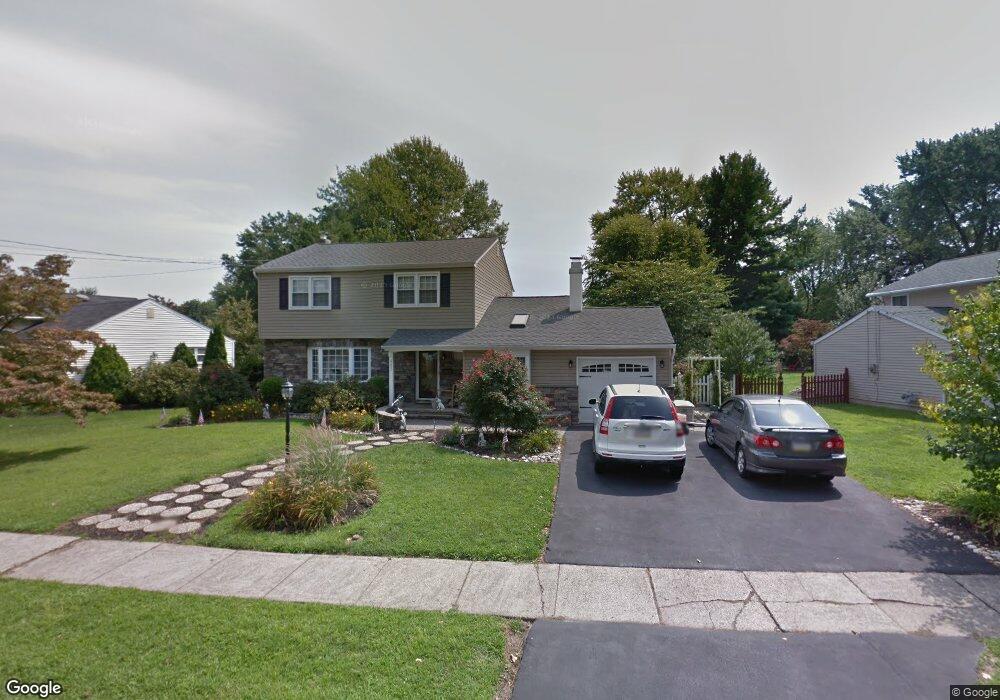
442 Silver Ave Southampton, PA 18966
Estimated Value: $481,000 - $519,770
4
Beds
2
Baths
1,747
Sq Ft
$286/Sq Ft
Est. Value
About This Home
This home is located at 442 Silver Ave, Southampton, PA 18966 and is currently estimated at $499,443, approximately $285 per square foot. 442 Silver Ave is a home located in Bucks County with nearby schools including Davis Elementary School, Klinger Middle School, and William Tennent High School.
Ownership History
Date
Name
Owned For
Owner Type
Purchase Details
Closed on
Dec 29, 2004
Sold by
Surman Claire M
Bought by
Ehret Joseph and Ehret Kerri Ann
Current Estimated Value
Home Financials for this Owner
Home Financials are based on the most recent Mortgage that was taken out on this home.
Original Mortgage
$210,000
Outstanding Balance
$106,446
Interest Rate
5.81%
Mortgage Type
Fannie Mae Freddie Mac
Estimated Equity
$392,997
Purchase Details
Closed on
May 4, 1966
Bought by
Surman Stuart A and Surman Claire M
Create a Home Valuation Report for This Property
The Home Valuation Report is an in-depth analysis detailing your home's value as well as a comparison with similar homes in the area
Home Values in the Area
Average Home Value in this Area
Purchase History
| Date | Buyer | Sale Price | Title Company |
|---|---|---|---|
| Ehret Joseph | $270,000 | -- | |
| Surman Stuart A | -- | -- |
Source: Public Records
Mortgage History
| Date | Status | Borrower | Loan Amount |
|---|---|---|---|
| Open | Ehret Joseph | $210,000 |
Source: Public Records
Tax History
| Year | Tax Paid | Tax Assessment Tax Assessment Total Assessment is a certain percentage of the fair market value that is determined by local assessors to be the total taxable value of land and additions on the property. | Land | Improvement |
|---|---|---|---|---|
| 2025 | $6,207 | $29,020 | $4,960 | $24,060 |
| 2024 | $6,207 | $29,020 | $4,960 | $24,060 |
| 2023 | $6,018 | $29,020 | $4,960 | $24,060 |
| 2022 | $5,892 | $29,020 | $4,960 | $24,060 |
| 2021 | $5,785 | $29,020 | $4,960 | $24,060 |
| 2020 | $5,705 | $29,020 | $4,960 | $24,060 |
| 2019 | $5,495 | $29,020 | $4,960 | $24,060 |
| 2018 | $5,369 | $29,020 | $4,960 | $24,060 |
| 2017 | $5,217 | $29,020 | $4,960 | $24,060 |
| 2016 | $5,217 | $29,020 | $4,960 | $24,060 |
| 2015 | -- | $29,020 | $4,960 | $24,060 |
| 2014 | -- | $30,800 | $4,960 | $25,840 |
Source: Public Records
Map
Nearby Homes
- 233 Sharpless Rd
- 1514 2nd Street Pike
- 28 Pennlyn Rd
- 84 Upland Dr
- 687 Bristol Rd
- 89 Upland Dr
- 159 Forrest Ave
- 36 Devon Rd
- 1007 Dick Ave
- 194 Fairhill Dr
- 145 Frog Hollow Rd
- 237 Frog Hollow Rd
- 771 Willow St
- 801 Cybus Way
- 165 Valley Dr
- 705 Overlook Dr
- 161 New Rd
- 143 Merry Dell Dr
- 756 Street Rd Unit 1
- 682 Whirlaway Dr
Your Personal Tour Guide
Ask me questions while you tour the home.