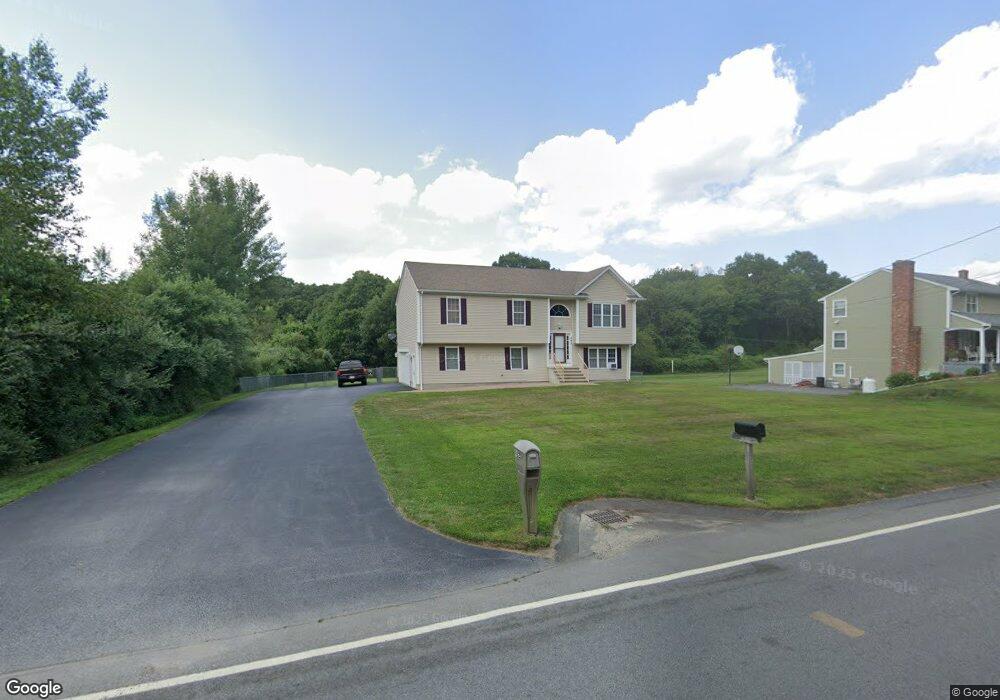
442 Vinnicum Rd Swansea, MA 02777
West Swansea NeighborhoodEstimated Value: $627,140 - $670,000
3
Beds
2
Baths
1,500
Sq Ft
$429/Sq Ft
Est. Value
About This Home
This home is located at 442 Vinnicum Rd, Swansea, MA 02777 and is currently estimated at $643,535, approximately $429 per square foot. 442 Vinnicum Rd is a home located in Bristol County with nearby schools including Joseph Case High School, Highlander Charter Middle and High School, and East Bay Career Academy.
Ownership History
Date
Name
Owned For
Owner Type
Purchase Details
Closed on
Dec 13, 2006
Sold by
S&N Homes Llc
Bought by
Vital Michael A and Vital Sherri L
Current Estimated Value
Home Financials for this Owner
Home Financials are based on the most recent Mortgage that was taken out on this home.
Original Mortgage
$175,000
Outstanding Balance
$104,629
Interest Rate
6.31%
Mortgage Type
Purchase Money Mortgage
Estimated Equity
$538,906
Create a Home Valuation Report for This Property
The Home Valuation Report is an in-depth analysis detailing your home's value as well as a comparison with similar homes in the area
Home Values in the Area
Average Home Value in this Area
Purchase History
| Date | Buyer | Sale Price | Title Company |
|---|---|---|---|
| Vital Michael A | $350,000 | -- | |
| Vital Michael A | $350,000 | -- |
Source: Public Records
Mortgage History
| Date | Status | Borrower | Loan Amount |
|---|---|---|---|
| Open | Vital Michael A | $175,000 | |
| Closed | Vital Michael A | $175,000 |
Source: Public Records
Tax History Compared to Growth
Tax History
| Year | Tax Paid | Tax Assessment Tax Assessment Total Assessment is a certain percentage of the fair market value that is determined by local assessors to be the total taxable value of land and additions on the property. | Land | Improvement |
|---|---|---|---|---|
| 2025 | $6,759 | $567,000 | $182,000 | $385,000 |
| 2024 | $6,858 | $572,000 | $182,000 | $390,000 |
| 2023 | $6,446 | $490,900 | $134,200 | $356,700 |
| 2022 | $6,143 | $426,900 | $122,500 | $304,400 |
| 2021 | $101 | $379,800 | $122,500 | $257,300 |
| 2020 | $5,994 | $384,700 | $122,500 | $262,200 |
| 2019 | $5,734 | $369,700 | $109,900 | $259,800 |
| 2018 | $5,473 | $358,200 | $108,200 | $250,000 |
| 2017 | $4,563 | $343,600 | $108,200 | $235,400 |
| 2016 | $4,710 | $348,400 | $100,700 | $247,700 |
| 2015 | $4,392 | $334,500 | $100,700 | $233,800 |
| 2014 | $3,975 | $309,600 | $100,700 | $208,900 |
Source: Public Records
Map
Nearby Homes
- 456 Vinnicum Rd
- 443 Vinnicum Rd
- 433 Vinnicum Rd
- 465 Vinnicum Rd
- 423 Vinnicum Rd
- 475 Vinnicum Rd
- 486 Vinnicum Rd
- 485 Vinnicum Rd
- 413 Vinnicum Rd
- 500 Vinnicum Rd
- 503 Vinnicum Rd
- 407 Vinnicum Rd
- 403 Vinnicum Rd
- 511 Vinnicum Rd
- 508 Vinnicum Rd
- 402 Vinnicum Rd
- 519 Vinnicum Rd
- 393 Vinnicum Rd
- 521 Vinnicum Rd
- 383 Vinnicum Rd