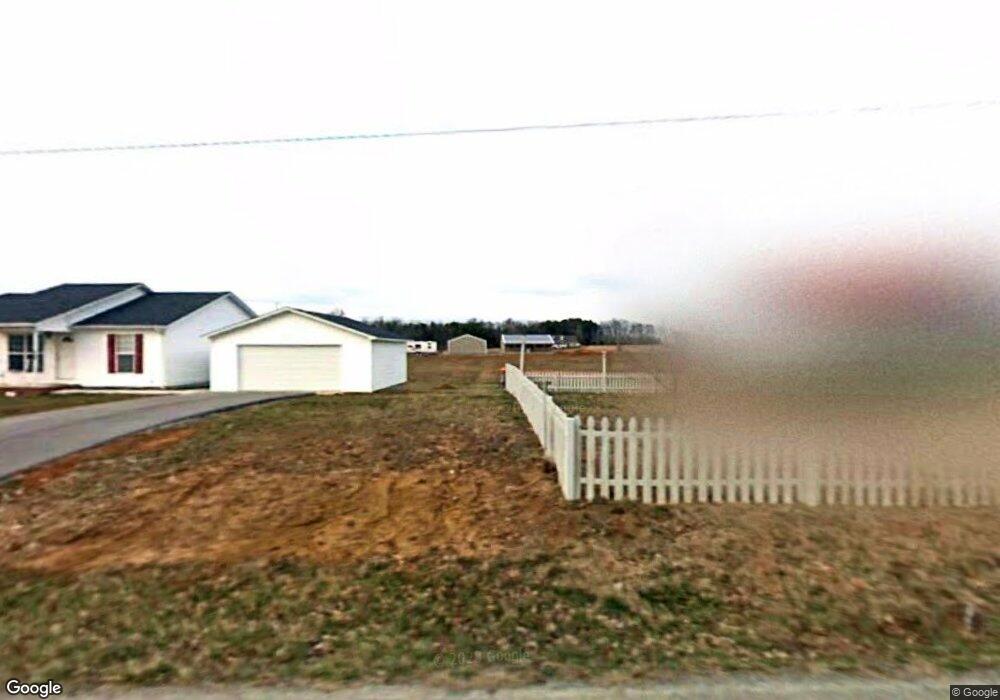
442 Zion Rd Cookeville, TN 38501
Estimated Value: $370,000 - $494,000
--
Bed
--
Bath
1,200
Sq Ft
$356/Sq Ft
Est. Value
About This Home
This home is located at 442 Zion Rd, Cookeville, TN 38501 and is currently estimated at $426,841, approximately $355 per square foot. 442 Zion Rd is a home located in Jackson County with nearby schools including Jackson County High School.
Ownership History
Date
Name
Owned For
Owner Type
Purchase Details
Closed on
Dec 22, 2020
Sold by
Bowman Edward M and Bowman Katrina
Bought by
Allen Kimberly A
Current Estimated Value
Home Financials for this Owner
Home Financials are based on the most recent Mortgage that was taken out on this home.
Original Mortgage
$160,000
Outstanding Balance
$8,542
Interest Rate
2.8%
Mortgage Type
New Conventional
Estimated Equity
$418,299
Purchase Details
Closed on
Feb 14, 2011
Sold by
Frazier Christopher
Bought by
Bowman Edward Micheal
Purchase Details
Closed on
May 24, 2007
Bought by
Dougherty Frazier Christopher Donald
Purchase Details
Closed on
Oct 28, 2002
Sold by
Regions Bank
Bought by
Allen Glen C
Purchase Details
Closed on
Sep 14, 2000
Sold by
Regions Bank
Bought by
Kenneth Judd
Purchase Details
Closed on
Aug 29, 2000
Sold by
Allen Glen S
Bought by
Regions Bank
Create a Home Valuation Report for This Property
The Home Valuation Report is an in-depth analysis detailing your home's value as well as a comparison with similar homes in the area
Home Values in the Area
Average Home Value in this Area
Purchase History
| Date | Buyer | Sale Price | Title Company |
|---|---|---|---|
| Allen Kimberly A | $257,100 | None Available | |
| Bowman Edward Micheal | $190,000 | -- | |
| Dougherty Frazier Christopher Donald | $40,000 | -- | |
| Allen Glen C | $11,460 | -- | |
| Kenneth Judd | $11,500 | -- | |
| Regions Bank | $11,460 | -- |
Source: Public Records
Mortgage History
| Date | Status | Borrower | Loan Amount |
|---|---|---|---|
| Open | Allen Kimberly A | $160,000 |
Source: Public Records
Tax History Compared to Growth
Tax History
| Year | Tax Paid | Tax Assessment Tax Assessment Total Assessment is a certain percentage of the fair market value that is determined by local assessors to be the total taxable value of land and additions on the property. | Land | Improvement |
|---|---|---|---|---|
| 2024 | $1,678 | $65,800 | $10,875 | $54,925 |
| 2023 | $1,678 | $65,800 | $10,875 | $54,925 |
| 2022 | $1,480 | $65,800 | $10,875 | $54,925 |
| 2021 | $1,480 | $65,800 | $10,875 | $54,925 |
| 2020 | $1,510 | $65,800 | $10,875 | $54,925 |
| 2019 | $1,510 | $54,125 | $11,025 | $43,100 |
| 2018 | $1,510 | $54,125 | $11,025 | $43,100 |
| 2017 | $1,510 | $54,125 | $11,025 | $43,100 |
| 2016 | $1,457 | $52,175 | $11,025 | $41,150 |
| 2015 | $1,487 | $52,175 | $11,025 | $41,150 |
| 2014 | $1,486 | $52,150 | $8,925 | $43,225 |
Source: Public Records
Map
Nearby Homes
- 388 Albert Swift Ln
- 343 Mabry School Rd
- 135 Young Mill Ln
- 16308 Dodson Branch Hwy
- 0 Dodson Branch Rd Unit RTC2965059
- 1748 Timber Trail
- 1737 Cummins Mill Rd
- 7630 Walking Horse Ln
- 7030 Dodson Branch Rd
- 1704 Timber Trail
- 6950 Dodson Branch Rd
- 259 Freewill Ridge Rd Unit 291
- 15826 Dodson Branch Hwy
- 00 Hardscrabble Ln
- 2220 SE Crag Rock