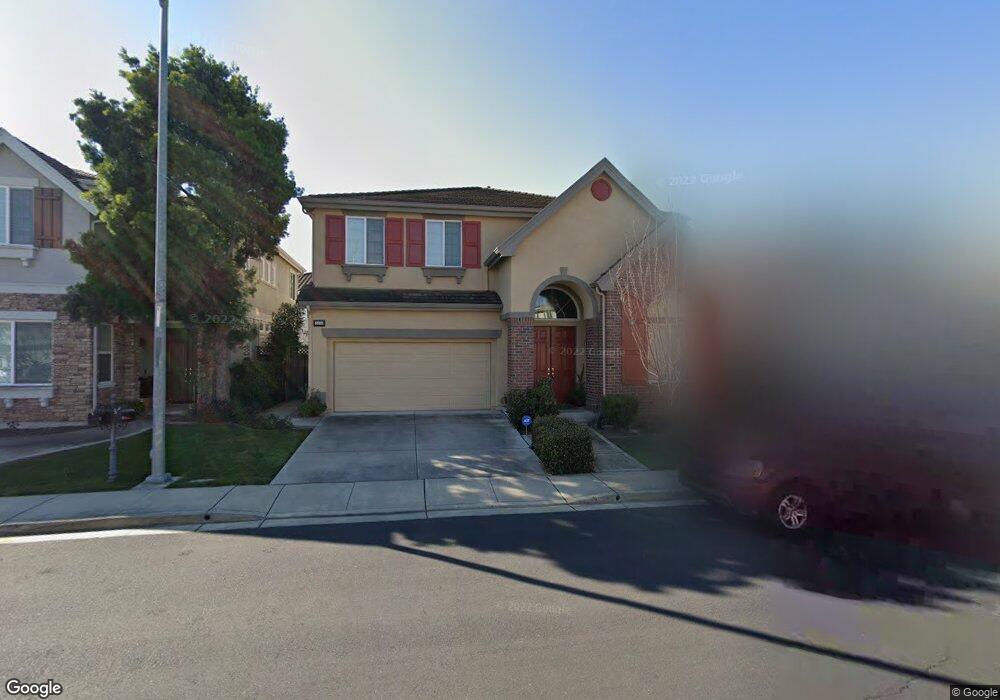
4420 Roscommon Way Dublin, CA 94568
Estimated Value: $1,703,000 - $1,854,000
4
Beds
3
Baths
2,902
Sq Ft
$615/Sq Ft
Est. Value
About This Home
This home is located at 4420 Roscommon Way, Dublin, CA 94568 and is currently estimated at $1,785,834, approximately $615 per square foot. 4420 Roscommon Way is a home located in Alameda County with nearby schools including James Dougherty Elementary School, Dublin High School, and SPRINGFIELD MONTESSORI SCHOOL.
Ownership History
Date
Name
Owned For
Owner Type
Purchase Details
Closed on
Jan 11, 2002
Sold by
So John John E
Bought by
Reyes So John John E and Reyes So Audrey
Current Estimated Value
Home Financials for this Owner
Home Financials are based on the most recent Mortgage that was taken out on this home.
Original Mortgage
$458,600
Outstanding Balance
$171,747
Interest Rate
5.87%
Estimated Equity
$1,614,087
Purchase Details
Closed on
Jan 8, 2002
Sold by
Toll Ca Ii Lp
Bought by
So John John E
Home Financials for this Owner
Home Financials are based on the most recent Mortgage that was taken out on this home.
Original Mortgage
$458,600
Outstanding Balance
$171,747
Interest Rate
5.87%
Estimated Equity
$1,614,087
Purchase Details
Closed on
Jan 7, 2002
Sold by
So Justina Audrey Reyes
Bought by
So John John E
Home Financials for this Owner
Home Financials are based on the most recent Mortgage that was taken out on this home.
Original Mortgage
$458,600
Outstanding Balance
$171,747
Interest Rate
5.87%
Estimated Equity
$1,614,087
Create a Home Valuation Report for This Property
The Home Valuation Report is an in-depth analysis detailing your home's value as well as a comparison with similar homes in the area
Purchase History
| Date | Buyer | Sale Price | Title Company |
|---|---|---|---|
| Reyes So John John E | -- | -- | |
| So John John E | $573,500 | First American Title Guarant | |
| So John John E | -- | First American Title Guarant |
Source: Public Records
Mortgage History
| Date | Status | Borrower | Loan Amount |
|---|---|---|---|
| Open | So John John E | $458,600 |
Source: Public Records
Tax History
| Year | Tax Paid | Tax Assessment Tax Assessment Total Assessment is a certain percentage of the fair market value that is determined by local assessors to be the total taxable value of land and additions on the property. | Land | Improvement |
|---|---|---|---|---|
| 2025 | $11,616 | $839,731 | $295,440 | $551,291 |
| 2024 | $11,616 | $823,131 | $289,648 | $540,483 |
| 2023 | $11,493 | $813,858 | $283,970 | $529,888 |
| 2022 | $11,350 | $790,900 | $278,402 | $519,498 |
| 2021 | $11,245 | $775,257 | $272,944 | $509,313 |
| 2020 | $10,537 | $774,238 | $270,146 | $504,092 |
| 2019 | $10,512 | $759,060 | $264,850 | $494,210 |
| 2018 | $10,260 | $744,179 | $259,658 | $484,521 |
| 2017 | $10,116 | $729,591 | $254,568 | $475,023 |
| 2016 | $9,243 | $715,290 | $249,578 | $465,712 |
| 2015 | $8,922 | $704,548 | $245,830 | $458,718 |
| 2014 | $8,912 | $690,751 | $241,016 | $449,735 |
Source: Public Records
Map
Nearby Homes
- 4480 Peacock Ct
- 4612 Sandyford Ct Unit 1302
- 4629 Sandyford Ct Unit 2206
- 4503 Sandyford Ct
- 4630 Central Pkwy Unit 29
- 5153 Aspen St
- 4585 Brannigan St
- 3769 Finnian Way Unit 52
- 3744 Whitworth Dr Unit 93
- 3730 Whitworth Dr
- 4126 Clarinbridge Cir
- 4138 Clarinbridge Cir
- 3989 Strafford Ct
- 4692 Rimini Ct
- 3703 Whitworth Dr
- 3710 Central Pkwy Unit 165
- 4685 Rimini Ct
- 5071 Winterbrook Ave
- 5089 Winterbrook Ave
- 4958 Trescott Ct
- 4408 Roscommon Way
- 4428 Roscommon Way
- 4419 Foxford Way
- 4407 Foxford Way
- 4382 Roscommon Way
- 4427 Foxford Way
- 4436 Roscommon Way
- 4381 Foxford Way
- 4421 Roscommon Way
- 4409 Roscommon Way
- 4429 Roscommon Way
- 4372 Roscommon Way
- 4371 Foxford Way
- 4405 Roscommon Way
- 4437 Roscommon Way
- 4361 Foxford Way
- 4362 Roscommon Way
- 4441 Roscommon Way
- 4422 Bangor Ct
- 4406 Foxford Way
Your Personal Tour Guide
Ask me questions while you tour the home.