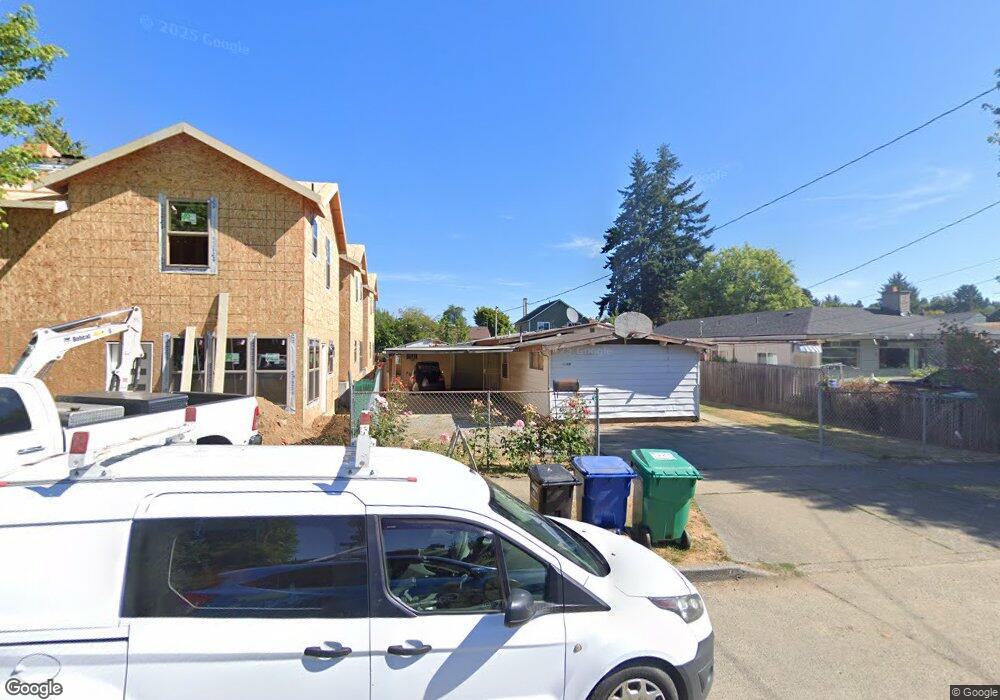
4420 S Frontenac St Seattle, WA 98118
Brighton NeighborhoodEstimated Value: $625,000 - $709,000
3
Beds
1
Bath
1,550
Sq Ft
$432/Sq Ft
Est. Value
About This Home
This home is located at 4420 S Frontenac St, Seattle, WA 98118 and is currently estimated at $669,869, approximately $432 per square foot. 4420 S Frontenac St is a home located in King County with nearby schools including Martin Luther King Jr. Elementary School, Aki Kurose Middle School, and Franklin High School.
Ownership History
Date
Name
Owned For
Owner Type
Purchase Details
Closed on
Apr 26, 1999
Sold by
Caoagdan David R and Caoagdan Marita C
Bought by
Caoagdan Ricuerdo L and Caoagdan Fely C
Current Estimated Value
Home Financials for this Owner
Home Financials are based on the most recent Mortgage that was taken out on this home.
Original Mortgage
$105,000
Outstanding Balance
$26,995
Interest Rate
6.98%
Estimated Equity
$642,874
Purchase Details
Closed on
Apr 11, 1996
Sold by
Entenman Dave V and Entenman Debra Jean
Bought by
Caoagdan Ricuerdo L and Caoagdan Fely C
Home Financials for this Owner
Home Financials are based on the most recent Mortgage that was taken out on this home.
Original Mortgage
$101,636
Interest Rate
7.41%
Purchase Details
Closed on
Feb 13, 1992
Sold by
Smothers Bettye
Bought by
Entenman Dave and Debra Jean
Create a Home Valuation Report for This Property
The Home Valuation Report is an in-depth analysis detailing your home's value as well as a comparison with similar homes in the area
Home Values in the Area
Average Home Value in this Area
Purchase History
| Date | Buyer | Sale Price | Title Company |
|---|---|---|---|
| Caoagdan Ricuerdo L | -- | Old Republic Title Ltd | |
| Caoagdan Ricuerdo L | $103,000 | Evergreen Title Co | |
| Entenman Dave | $88,000 | -- |
Source: Public Records
Mortgage History
| Date | Status | Borrower | Loan Amount |
|---|---|---|---|
| Open | Caoagdan Ricuerdo L | $105,000 | |
| Previous Owner | Caoagdan Ricuerdo L | $101,636 | |
| Closed | Caoagdan Ricuerdo L | $25,500 |
Source: Public Records
Tax History Compared to Growth
Tax History
| Year | Tax Paid | Tax Assessment Tax Assessment Total Assessment is a certain percentage of the fair market value that is determined by local assessors to be the total taxable value of land and additions on the property. | Land | Improvement |
|---|---|---|---|---|
| 2024 | $6,347 | $605,000 | $538,000 | $67,000 |
| 2023 | $5,698 | $566,000 | $529,000 | $37,000 |
| 2022 | $5,365 | $617,000 | $502,000 | $115,000 |
| 2021 | $4,984 | $534,000 | $454,000 | $80,000 |
| 2020 | $4,609 | $469,000 | $398,000 | $71,000 |
| 2018 | $3,745 | $410,000 | $168,000 | $242,000 |
| 2017 | $2,988 | $340,000 | $148,000 | $192,000 |
| 2016 | $2,746 | $275,000 | $124,000 | $151,000 |
| 2015 | $2,431 | $247,000 | $110,000 | $137,000 |
| 2014 | -- | $223,000 | $96,000 | $127,000 |
| 2013 | -- | $192,000 | $117,000 | $75,000 |
Source: Public Records
Map
Nearby Homes
- 6905 46th Ave S
- 4819 S S Myrtle St
- 4507 S Holly St
- 4407 S Holly St
- 4405 S Holly St
- 4405 B S Holly St
- 7030 42nd Ave S
- 6945 42nd Ave S
- 9205 42nd Ave S
- 6711 42nd Ave S
- 6754 40th Ave S
- 4636 S Othello St
- 6211 Rainier Ave S
- 6198 Rainier Ave S
- 3520 S Morgan St
- 4910 S Willow St Unit B
- 3910 S Holly St
- 7343 Mlk jr Way S Unit 312
- 7343 Mlk jr Way S Unit 309
- 4708 S Morgan St
- 4426 S Frontenac St
- 4414 S Frontenac St
- 4430 S Frontenac St
- 4410 S Frontenac St
- 4434 S Frontenac St
- 4423 S Willow St
- 4427 S Willow St
- 4417 S Willow St
- 4431 S Willow St
- 6920 44th Ave S
- 6914 44th Ave S
- 4413 S Willow St
- 4421 S Frontenac St
- 4427 S Frontenac St
- 4435 S Willow St
- 6908 44th Ave S
- 4413 S Frontenac St
- 4435 S Frontenac St
- 4444 S Frontenac St
- 4501 S Willow St